. 2025 May 15;152(10):dev204687.
doi: 10.1242/dev.204687. Epub 2025 May 19.

Specific mitotic events drive left-right organizer development

Affiliations

Specific mitotic events drive left-right organizer development

Yan Wu et al. Development. .

Abstract

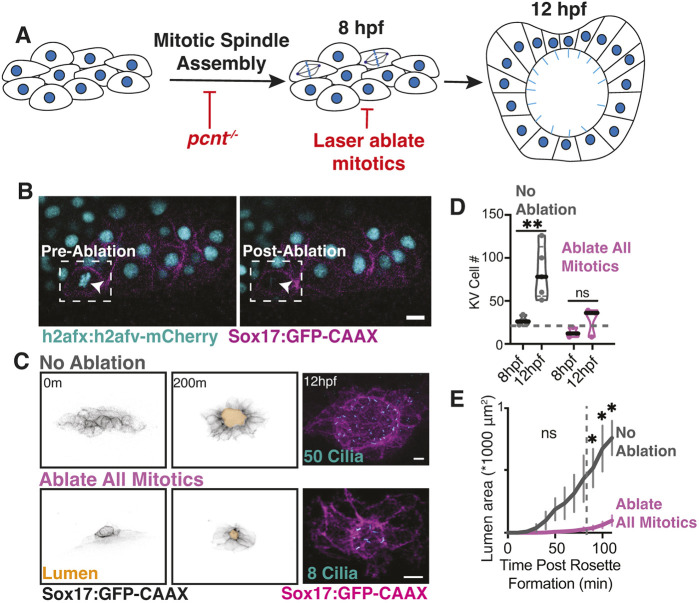
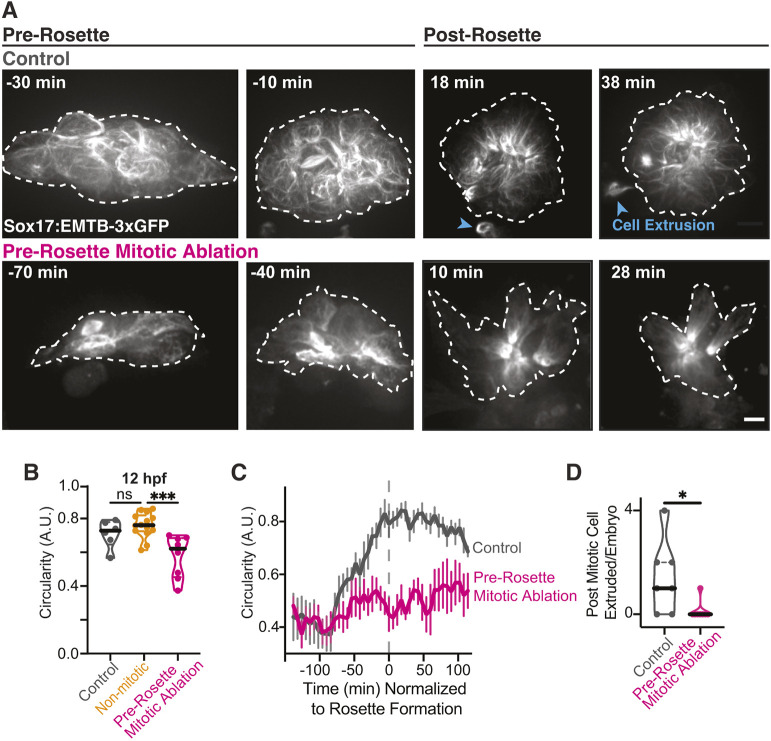
Cell proliferation is crucial for tissue development. Here, we investigate its role in the left-right organizer, which establishes the left-right axis. In zebrafish, we mapped mitotic events in Kupffer's vesicle (KV) and identified an anteriorly enriched, FGF-dependent mitotic pattern. Laser ablation of mitotic cells and pericentrin-null mutants, both reducing mitotic events, resulted in smaller lumens, confirming that cell division is essential for KV development. Pericentrin-null mutants also exhibited defects in leftward cardiac jogging, indicative of KV dysfunction. Using a KV-specific fluorescent microtubule marker, we found that the KV rosette is a transient, centrally organized cluster interconnected by cytokinetic bridges and containing microtubule bundles. This structure emerges after the first four divisions and precedes lumen formation. Mitotic events during KV rounding coincide with rosette formation, spindle rotation and cell extrusion, likely driven by increased packing. Eliminating the first four mitotic events disrupted rosette formation and prevented normal KV rounding. These findings demonstrate that mitotic events are crucial for KV development, with cell division timing shaping KV architecture and function.

Keywords: Cell patterning; Cilia; Cytokinesis; Left-right organizer; Lumen formation; Microtubules; Mitosis; Rosette.


Conflict of interest statement

Competing interests The authors declare no competing or financial interests.

Figures

Fig. 1.
Fig. 1.
KV developmental defects and loss of mitotic events in pericentrin-null embryos are associated with reduced survival and increased left-right axis defects. (A) Percentage embryo survival from wild-type control crosses and embryos from pericentrin-null (pcnt−/−) crosses. n≥7 clutches shown at 24 hpf; each dot represents one clutch. Data are mean±s.e.m. ****P<0.0001 (unpaired, two-tailed Student's t-test). (B) Percentage pcnt−/− embryo survival from 1 hpf to 24 hpf across three clutches. Error bars represent s.e.m. (C) Representative images of 60 hpf wild-type and pcnt−/− fish with Tg(myl7:GFP) hearts shown with a normal cardiac loop (D-loop), an inverted loop (L-loop) and no loop. Scale bar: 100 μm. (D) Percentage of embryos with D-loop, L-loop and no loop calculated from wild-type and pcnt−/− clutches combined. n=2 clutches measured for wild type, n=4 clutches for pcnt−/− embryos; total embryo number ≥113 per condition. (E) Confocal projections of pre-lumen (8 hpf, left) and post-lumen (12 hpf, right) KVs lacking pericentrin (pcnt−/−) compared with wild-type control (pcnt+/+). KV cell membranes are marked with Sox17:GFP-CAAX (inverted gray), mitotic events with PH3 (magenta). Lumens were traced and highlighted in gold. Scale bar: 10 μm. (F-H) Percentage of mitotic KV cells (F), KV cell number (G) and lumen area (H) were measured for n≥23 embryos (small dots represent embryos color coded to match clutch) across n≥3 clutches (large dots represent clutch) per condition. Graphs are super plots (as defined by Lord et al., 2020) with mean of clutches shown ±s.e.m. **P<0.01, ****P<0.0001 (unpaired, two-tailed Student's t-test); ns, not significant.
Fig. 2.
Fig. 2.
KV-specific mitotic events contribute to KV development. (A) Model illustrating experimental approaches to identify the role of mitotic events on KV development. Pale blue lines represent cilia. (B) Representative images of the KV ablation experiment showing a pre-ablation and post-ablation cell. White arrowheads highlight the KV cell ablated. KV cell membranes marked by Sox17:GFP-CAAX (magenta) and nuclei with h2afx:h2afv-mCherry (cyan). Scale bar: 10 μm. (C) Confocal projections taken from a movie acquisition (0-200 min, Sox17:GFP-CAAX, inverted gray; see also Movie 1). Lumens were traced and highlighted in gold. The embryo was fixed at 12 hpf and stained for cilia (acetylated tubulin, cyan; Sox17:GFP-CAAX, magenta). The number of cilia in each representative image is noted. m, min. Scale bars: 10 μm. (D) Truncated violin plot depicting the number of KV cells at 8 hpf and 12 hpf for ‘no ablation’ and ‘all mitotics ablated’ conditions across n≥3 embryos (each point represents a single embryo). Median denoted with black line and 20 KV cell threshold demonstrated with gray dashed line. **P<0.01 (unpaired, two-tailed Student's t-test); ns, not significant. (E) Lumen area was measured over time for over 100 min for ‘no ablation’ (control) and ‘all mitotics ablated’ conditions. n≥3 embryos measured per condition. Error bars represent s.e.m. *P<0.05 (unpaired, two-tailed Student's t-test); ns, not significant.
Fig. 3.
Fig. 3.
Identification of an increased number of anteriorly enriched mitotic cells in the KV prior to lumen formation compared to evenly distributed post-mitotic cells post lumen formation. (A) Representative confocal projections from KV development movie (Movie 2). Pre-KV lumen time point (−22 min before lumen opening) and post-lumen (26 min after lumen opening) are shown. KV cell membranes are marked by Sox17:GFP-CAAX (magenta) and nuclei with h2afx:h2afv-mCherry (non-mitotic, cyan; mitotic, yellow). Scale bar: 10 μm. (B) Percentage of KV cells that are mitotic in 20 min bins (data points) throughout a 120 min movie time course (n=3 embryos; error bars represent s.e.m.). (C) Percentage of mitotic KV cells was measured for n≥23 embryos (small dots represent embryos color coded to match clutch) across n≥3 clutches (large dots represent clutch) at 8 hpf and 12 hpf. Graphs are super plots with mean of clutches ±s.e.m. ***P<0.001 (unpaired, two-tailed Student's t-test). (D) Confocal projections of mitotic (PH3, magenta) and post-mitotic (BrdU, magenta) events at pre lumen (8 hpf) and post lumen (12 hpf) stages. KV cell membranes are marked with Sox17:GFP-CAAX (inverted gray). Dashed line indicates division of the KV into anterior and posterior regions. Scale bars: 10 μm. (E) Fraction of PH3- and BrdU-positive cells in the anterior versus posterior regions of the KV (n=4 clutches, 36 embryos; and n=3 clutches, n=17 embryos, respectively, for PH3 and BrdU). Each point represents an embryo, and the point colors represent clutch. **P<0.01 (unpaired, two-tailed Student's t-test). (F,G) Confocal projections of H2B-Dendra photoconversion (non-photoconverted black nuclei; photo-converted in fire-LUT). Cyan and magenta outlines mark mitotic photoconverted event at 10 min. A total of eight mitotic events were photoconverted. Daughter cell positioning at 96 min and 180 min is shown (G). (F′) Trajectory of marked mitotic events from division completion to 96 min. KV cell boundary, green outline. Scale bars: 10 μm. (H) Temporal schematic of KV mitotic event for the representative embryo shown in F; the daughter cells did not divide again.
Fig. 4.
Fig. 4.
FGF contributes to mitotic events being enriched at the anterior half of the KV. (A) Model illustrating the experimental approach to identify whether a signal influences mitotic events during KV development. Pale blue lines represent cilia. (B-D) Confocal projections of post lumen (12 hpf) embryos treated with methanol (control), 50 μM cyclopamine (B), DMSO (control), 10 μM XAV939 (C), or 0.5 μM, 1 μM, 3 μM or 5 μM infigratinib (D). KV cell membranes are marked with Sox17:GFP-CAAX (inverted gray), lumens are highlighted in gold. Scale bars: 10 μm. (E) Lumen area was measured for n≥29 embryos per control and 1 μM infigratinib (FGF inhibition) conditions. Super plot is shown with small dots representing each embryo and color coded to match clutch. n≥3 clutches were measured with large dots representing clutch. Mean of clutches is shown ±s.e.m. ****P<0.0001 (unpaired, two-tailed Student's t-test). (F) Confocal projections of 8 hpf KVs treated with DMSO (control) or 1 μM infigratinib (FGF inhibition). Mitotic events were marked with PH3 (magenta). KV cell membranes were marked with Sox17:GFP-CAAX (inverted gray). Scale bar: 10 μm. (G) Percentage mitotics within developing KVs at 8 hpf was measured for n≥53 embryos per control and 1μM infigratinib (FGF inhibition) conditions. Super plot shown with small dots representing each embryo and are color coded to match clutch. n≥3 clutches were measured with large dots representing clutch. Mean of clutches shown ±s.e.m. **P<0.01 (unpaired, two-tailed Student's t-test). (H) Fraction of PH3-positive cells in the anterior versus posterior regions of the KV at 8 hpf. n≥33 embryos were used per control and 1 μM infigratinib (FGF inhibition) conditions. Each point represents an embryo, the point colors represent clutch, n≥3 clutches. ****P<0.0001 (unpaired, two-tailed Student's t-test); ns, not significant.
Fig. 5.
Fig. 5.
Early KV divisions stably position spindles until the KV starts rounding, then the few cells that enter mitosis are unable to stably position their spindle and are extruded. (A,B) Stills from time-lapse movie of microtubule organization during KV formation (Sox17:EMTB-3xGFP, gray). KVs are outlined (white dashed line). Highlighted are spindles (yellow arrowheads) and cytokinetic bridges (pink arrowheads). The blue boxed region is magnified in B showcasing a spinning mitotic spindle that becomes extruded. Mitotic spindle poles are noted with blue and pink arrowheads. An extruded cytokinetic KV cell post-spinning event is outlined (orange dashed line). Scale bars: 10 μm. See also Movie 3. (C) Method of measurement of the KV aspect ratio (AR) and the angular velocity of the spindle (ω∠a), illustrated schematically. (D,E) Floating bar graphs depicting the maximum, minimum and mean of KV spindle angular velocity (D) and mitotic extrusion events (E). For D, 58 spindle poles from seven embryos across six clutches were measured. *P<0.05 (one-way ANOVA). For E, the percentage of extruded mitotic events in 40 min bins relative to lumen formation were measured for seven embryos from six clutches. (E′) The percentage of mitotic events with post mitotic cell extrusions pre- versus post-lumen formation. n=7 embryos from 6 clutches. *P<0.05 (unpaired two-tailed t-tests). ns, not significant. (F) 3D surface rendering of a representative KV (gray) at pre-lumen stage (40 min, left; 120 min, middle) and post-lumen stage (202 min, right). The x-axis, y-axis and z-axis are indicated by red, green and blue arrows of the reference frame, respectively. Scale bar: 10 μm. (G) Relative KV volume (magenta; n=3 from 3 clutches), AR (cyan; n=7 from 6 clutches) and circularity (gray; n=6 from 6 clutches) over time normalized to lumen opening (marked by gray dashed line). Error bars represent s.e.m. A.U., arbitrary units.
Fig. 6.
Fig. 6.
Pre-rosette mitotic events play an indispensable role in cell packing and subsequent cell extrusion during lumen formation. (A) Stills from a time-lapse movie of microtubule organization during KV formation (Sox17:EMTB-3xGFP; gray). KVs are outlined (white dashed line) for control (no ablation, top) and pre-rosette mitotic cell ablation conditions (bottom). Time is normalized to rosette formation (0 min); pre-rosette 0 to −70 min, post rosette is 0 to 30 min. Extruded cells are indicated with blue arrowheads and KV outline is highlighted by a white dashed line. Scale bar: 10 μm. See also Movie 4. (B) Truncated violin plot of KV circularity at 12 hpf. Control, non-mitotic cell ablation, and pre-rosette mitotic ablation conditions are shown. Median denoted with black line and quartile denoted by dashed line. n≥6 embryos were used across each condition. ***P<0.001 (one-way ANOVA with Dunnett's multiple comparison to non-mitotic cell ablation); ns, not significant. (C) Circularity of KV was measured over time normalized to rosette formation (marked by gray dashed line). Control (no ablation, gray) and ablation of pre-rosette mitotic events (four cells ablated, magenta) are shown. n≥6 embryos per condition. Error bars represent s.e.m. (D) Truncated violin plots of post mitotic cell extrusion events per embryo for control (no ablation) and ablation of pre-rosette mitotic events. Median denoted with black line and quartile denoted by dashed line. n≥6 embryos per condition. *P<0.05 (unpaired, two-tailed Student's t-test).
Fig. 7.
Fig. 7.
Early KV developmental mitotic events hold greater significance to KV development compared to later KV mitotic events. (A) Model illustrating laser ablation conditions during KV development. Pale blue lines represent cilia. (B) Confocal projections taken from a movie acquisition (0-200 min, left; Sox17:GFP-CAAX, inverted gray; lumen, gold; see also Movie 5). The embryos were then fixed at 6SS (12 hpf) and stained for cilia (acetylated tubulin, cyan, right; Sox17:GFP-CAAX in magenta). The number of cilia in each representative image is noted. m, min. Scale bars: 10 μm. (C) Truncated violin plot depicting the number of KV cells at 8 hpf and 12 hpf for ablation conditions 1, 2 or 3 across n≥3 embryos (each point represents a single embryo). Median denoted with black line and 20 KV cell threshold demonstrated with gray dashed line. *P<0.05 (unpaired, two-tailed Student's t-test); ns, not significant. (D) Lumen area was measured over time for over 100 min for ablation conditions 1, 2, 3, or a single mitotic cell ablation. n≥3 embryos measured per condition. Error bars represent s.e.m. *P<0.05, **P<0.01, ***P<0.001 (one-way ANOVA with Dunnett's multiple comparison); ns, not significant. (E,F) Truncated violin plots depicting KV lumen area (12 hpf; E) and percentage of ciliated KV cells (F). n≥3 embryos for each condition. *P<0.05, ***P<0.001 (one-way ANOVA with Dunnett's multiple comparison to non-mitotic ablation controls); ns, not significant. A.U., arbitrary units; Cond., condition.
Fig. 8.
Fig. 8.
Model for mitotic and cellular events that occur during KV development. (A) Anterior KV precursor cells are stimulated by FGF to enter mitosis. (B) KV cells begin to form small rosettes, comprising both post-mitotic cells and those still dividing, with mitotic activity concentrated anteriorly. (C) Cells transition into a single rosette, with anterior post-mitotic cells contributing cytokinetic bridges toward the rosette center. (D) The rosette matures into a ciliated KV with a fluid-filled lumen, and post-mitotic cells become evenly distributed. MTs, microtubules.

Update of

Similar articles

Cited by

References

    1. Abdel-Razek, O., Marzouk, A., MacKinnon, M., Guy, E. T., Pohar, S. A., Zhushma, E., Liu, J., Sia, I., Gokey, J. J., Tay, H. G.et al. (2023). Calcium signaling mediates proliferation of the precursor cells that give rise to the ciliated left-right organizer in the zebrafish embryo. Front. Mol. Biosci. 10, 1292076. 10.3389/fmolb.2023.1292076 - DOI - PMC - PubMed
    1. Aljiboury, A. A., Mujcic, A., Cammerino, T., Rathbun, L. I. and Hehnly, H. (2021). Imaging the early zebrafish embryo centrosomes following injection of small-molecule inhibitors to understand spindle formation. STAR Protoc. 2, 100293. 10.1016/j.xpro.2020.100293 - DOI - PMC - PubMed
    1. Aljiboury, A. A., Ingram, E., Krishnan, N., Ononiwu, F., Pal, D., Manikas, J., Taveras, C., Hall, N. A., Da Silva, J., Freshour, J.et al. (2023). Rab8, Rab11, and Rab35 coordinate lumen and cilia formation during zebrafish left-right organizer development. PLoS Genet. 19, e1010765. 10.1371/journal.pgen.1010765 - DOI - PMC - PubMed
    1. Anton, K. A., Kajita, M., Narumi, R., Fujita, Y. and Tada, M. (2018). Src-transformed cells hijack mitosis to extrude from the epithelium. Nat. Commun. 9, 4695. 10.1038/s41467-018-07163-4 - DOI - PMC - PubMed
    1. Arrington, C. B., Peterson, A. G. and Yost, H. J. (2013). Sdc2 and Tbx16 regulate Fgf2-dependent epithelial cell morphogenesis in the ciliated organ of asymmetry. Development 140, 4102-4109. 10.1242/dev.096933 - DOI - PMC - PubMed

LinkOut - more resources