

Construction of a programmed activation nanosystem based on intracellular hypoxia in cisplatin-resistant tumor cells for reversing cisplatin resistance
- PMID: 40230650
- PMCID: PMC11995088
- DOI: 10.1016/j.mtbio.2025.101709
Construction of a programmed activation nanosystem based on intracellular hypoxia in cisplatin-resistant tumor cells for reversing cisplatin resistance
Abstract
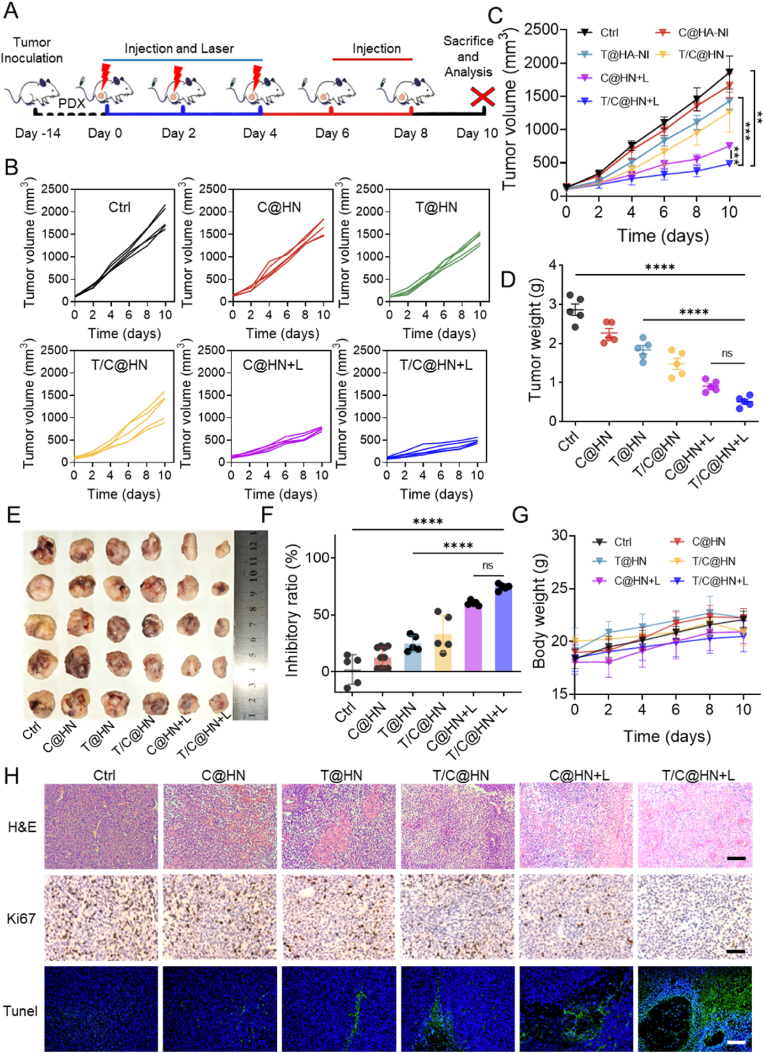
Cancer poses a significant threat to human life and health. Cancers treated with cisplatin invariably develop drug resistance. This challenge can be overcome by identifying and exploiting the vulnerabilities acquired by drug-resistant cancer cells, paving the way for finding effective novel treatment options for cisplatin-resistant cancers. Our previous study revealed that cisplatin resistance in cancer cells comes at the cost of increased intracellular hypoxia. In this study, we used 2-nitroimidazole modified hyaluronic acid (HA-NI) as the carrier. The cisplatin-resistant tumor cell specific intracellular hypoxia programmed activation nanomedicine (T/C@HN NPs) was constructed by the hypoxic toxic drug tirapazamine (TPZ) and encapsulating chlorin e6 (Ce6) into HA-NI using polymer assembly technology. The amphiphilic carrier could release free Ce6 molecules under the stimulation of intracellular hypoxic environment, and exhibit specific "activated state" photodynamic properties in cisplatin-resistant tumor cells. Upon irradiation, Ce6-mediated photodynamic therapy further intensifies hypoxia, amplifying its cytotoxicity. This project systematically evaluated the effects of T/C@HN NPs on the identification and recognition of cisplatin-resistant tumors using drug-resistant patient-derived xenograft (PDX) models. This study provides a promising avenue for the development of novel treatment of cisplatin-resistant tumors.
Keywords: Cisplatin-resistant; Hypoxia activation; Intracellular hypoxia; Nanomedicine; Program activation.
© 2025 The Authors. Published by Elsevier Ltd.
Conflict of interest statement
The authors declare that they have no known competing financial interests or personal relationships that could have appeared to influence the work reported in this paper.
Figures


Similar articles
-
Exploiting the acquired vulnerability of cisplatin-resistant tumors with a hypoxia-amplifying DNA repair-inhibiting (HYDRI) nanomedicine.Sci Adv. 2021 Mar 26;7(13):eabc5267. doi: 10.1126/sciadv.abc5267. Print 2021 Mar. Sci Adv. 2021. PMID: 33771859 Free PMC article.
-
Targeted co-delivery of a photosensitizer and an antisense oligonucleotide based on an activatable hyaluronic acid nanosystem with endogenous oxygen generation for enhanced photodynamic therapy of hypoxic tumors.Acta Biomater. 2022 Nov;153:419-430. doi: 10.1016/j.actbio.2022.09.025. Epub 2022 Sep 14. Acta Biomater. 2022. PMID: 36115655
-
Cancer-Selective Bioreductive Chemotherapy Mediated by Dual Hypoxia-Responsive Nanomedicine upon Photodynamic Therapy-Induced Hypoxia Aggravation.Biomacromolecules. 2019 Jul 8;20(7):2649-2656. doi: 10.1021/acs.biomac.9b00428. Epub 2019 Jun 11. Biomacromolecules. 2019. PMID: 31125209
-
Hypoxia and Singlet Oxygen Dual-Responsive Micelles for Photodynamic and Chemotherapy Therapy Featured with Enhanced Cellular Uptake and Triggered Cargo Delivery.Int J Nanomedicine. 2024 Jan 12;19:247-261. doi: 10.2147/IJN.S432407. eCollection 2024. Int J Nanomedicine. 2024. PMID: 38229704 Free PMC article.
-
Targeted delivery and enhanced uptake of chemo-photodynamic nanomedicine for melanoma treatment.Acta Biomater. 2022 Jul 15;147:356-365. doi: 10.1016/j.actbio.2022.05.015. Epub 2022 May 14. Acta Biomater. 2022. PMID: 35577046
References
-
- Yu B.Z., et al. Platinum prodrug nanoparticles with COX-2 inhibition amplify pyroptosis for enhanced chemotherapy and immune activation of pancreatic cancer. Adv. Mater. 2024;36(11) - PubMed
-
- Karakonstantis S., et al. Global prevalence of cefiderocol non-susceptibility in Enterobacterales, Pseudomonas aeruginosa, Acinetobacter baumannii, and Stenotrophomonas maltophilia: a systematic review and meta-analysis. Clin. Microbiol. Infection. 2024;30(2):178–188. - PubMed
-
- Yan J., et al. Rewiring chaperone-mediated autophagy in cancer by a prion-like chemical inducer of proximity to counteract adaptive immune resistance. Drug Resist. Updates. 2024;73 - PubMed
LinkOut - more resources
Full Text Sources
