

The Comprehensive Analysis of Weighted Gene Co-Expression Network Analysis and Machine Learning Revealed Diagnostic Biomarkers for Breast Implant Illness Complicated with Breast Cancer
- PMID: 40230814
- PMCID: PMC11996000
- DOI: 10.2147/BCTT.S507754
The Comprehensive Analysis of Weighted Gene Co-Expression Network Analysis and Machine Learning Revealed Diagnostic Biomarkers for Breast Implant Illness Complicated with Breast Cancer
Abstract
Purpose: An increasing number of breast cancer (BC) patients choose prosthesis implantation after mastectomy, and the occurrence of breast implant illness (BII) has received increasing attention and the underlying molecular mechanisms have not been clearly elucidated. This study aimed to identify the crosstalk genes between BII and BC and explored their clinical value and molecular mechanism initially.
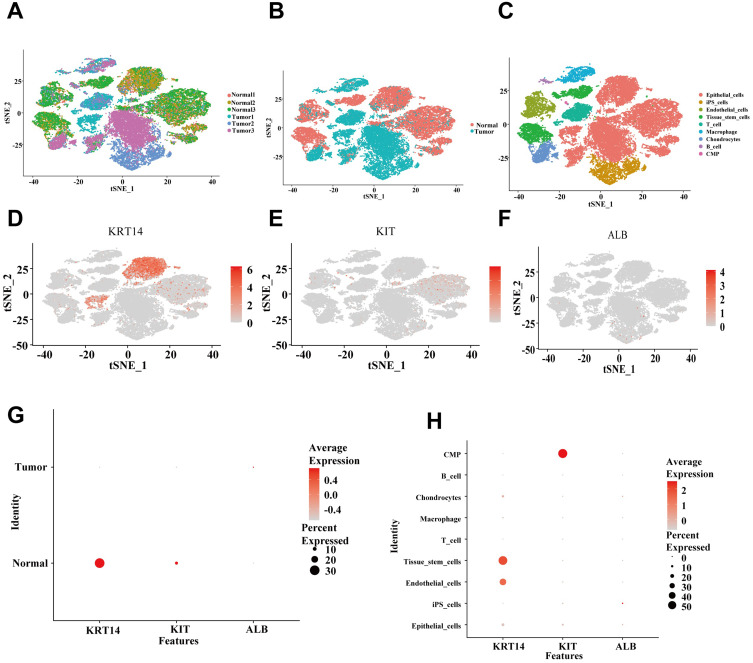
Methods: We retrieved the data from Gene Expression Omnibus (GEO) and The Cancer Genome Atlas (TCGA), and identified the differentially expressed genes (DEG) as well as module genes using Limma and weighted gene co-expression network analysis (WGCNA). Enrichment analysis, the protein-protein interaction network (PPI), and machine learning algorithms were performed to explore the hub genes. We employed a nomogram and receiver operating characteristic curve to evaluate the diagnostic accuracy. Single-cell analysis disclosed variations in the expression of key genes across distinct cellular populations. The expression levels of the key genes were further confirmed in BC cell lines. Immunohistochemical analysis was utilized to examine protein levels from 25 patients with breast cancer undergoing prosthetic implant surgery. Ultimately, we deployed single-sample Gene Set Enrichment Analysis (ssGSEA) to scrutinize the immunological profiles between the normal and BC cohorts, as well as between the non-BII and BII groups.
Results: WGCNA identified 1137 common genes, whereas DEG analysis found 541 overlapping genes in BII and BC. After constructing the PPI network, 17 key genes were selected, and three potential hub genes include KRT14, KIT, ALB were chosen for nomogram creation and diagnostic assessment through machine learning. The validation of these results was conducted by examining gene expression patterns in the validation dataset, breast cancer cell lines, and BII-BC patients. However, ssGSEA uncovered different immune cell infiltration patterns in BII and BC.
Conclusion: We pinpointed shared three central genes include KRT14, KIT, ALB and molecular pathways common to BII and BC. Shedding light on the complex mechanisms underlying these conditions and suggesting potential targets for diagnostic and therapeutic strategies.
Keywords: breast cancer; breast implant illness; hub genes; weighted gene co-expression network analysis.
© 2025 Huang et al.
Conflict of interest statement
Mengyao Zeng is employed by Aimiker Technology Development Co., Ltd. The authors report no other conflicts of interest in this work.
Figures


Similar articles
-
Exploration of effective biomarkers for venous thrombosis embolism in Behçet's disease based on comprehensive bioinformatics analysis.Sci Rep. 2024 Jul 10;14(1):15884. doi: 10.1038/s41598-024-66973-3. Sci Rep. 2024. PMID: 38987624 Free PMC article.
-
Elucidating the molecular and immune interplay between head and neck squamous cell carcinoma and diffuse large B-cell lymphoma through bioinformatics and machine learning.Transl Cancer Res. 2024 Nov 30;13(11):5725-5750. doi: 10.21037/tcr-24-1064. Epub 2024 Nov 21. Transl Cancer Res. 2024. PMID: 39697749 Free PMC article.
-
Screening of novel biomarkers for breast cancer based on WGCNA and multiple machine learning algorithms.Transl Cancer Res. 2023 Jun 30;12(6):1466-1489. doi: 10.21037/tcr-23-3. Epub 2023 Jun 20. Transl Cancer Res. 2023. PMID: 37434679 Free PMC article.
-
Screening and identification of the hub genes in severe acute pancreatitis and sepsis.Front Mol Biosci. 2024 Sep 19;11:1425143. doi: 10.3389/fmolb.2024.1425143. eCollection 2024. Front Mol Biosci. 2024. PMID: 39364223 Free PMC article.
-
Proposing a novel molecular subtyping scheme for predicting distant recurrence-free survival in breast cancer post-neoadjuvant chemotherapy with close correlation to metabolism and senescence.Front Endocrinol (Lausanne). 2023 Oct 12;14:1265520. doi: 10.3389/fendo.2023.1265520. eCollection 2023. Front Endocrinol (Lausanne). 2023. PMID: 37900131 Free PMC article. Review.
References
-
- Roberts K, Mills N, Metcalfe C, et al. Best-BRA (Is subpectoral or prepectoral implant placement best in immediate breast reconstruction?): a protocol for a pilot randomised controlled trial of subpectoral versus prepectoral immediate implant-based breast reconstruction in women following mastectomy. BMJ Open. 2021;11(11):e050886. doi:10.1136/bmjopen-2021-050886 - DOI - PMC - PubMed
LinkOut - more resources
Full Text Sources
Research Materials
Miscellaneous
