

Discovering biomarkers associated with infiltration of CD8+ T cells and tumor-associated fibrosis in colon adenocarcinoma using single-cell RNA sequencing and gene co-expression network
- PMID: 40230854
- PMCID: PMC11994618
- DOI: 10.3389/fimmu.2025.1496640
Discovering biomarkers associated with infiltration of CD8+ T cells and tumor-associated fibrosis in colon adenocarcinoma using single-cell RNA sequencing and gene co-expression network
Abstract
Background: Colorectal adenocarcinoma (COAD) is a prevalent malignant tumor associated with a high mortality rate. Within the tumor microenvironment, CD8+ T cells play a pivotal role in the anti-tumor immune response within the human body. Fibrosis directly and indirectly affects the therapeutic response of tumor immunotherapy. However, the significance of regulatory genes associated with tumor-associated fibrosis and CD8+ T cell infiltration remains uncertain. Therefore, it is imperative to identify biomarkers with prognostic value and elucidate the precise role of CD8+ T cells and tumor-associated fibrosis.
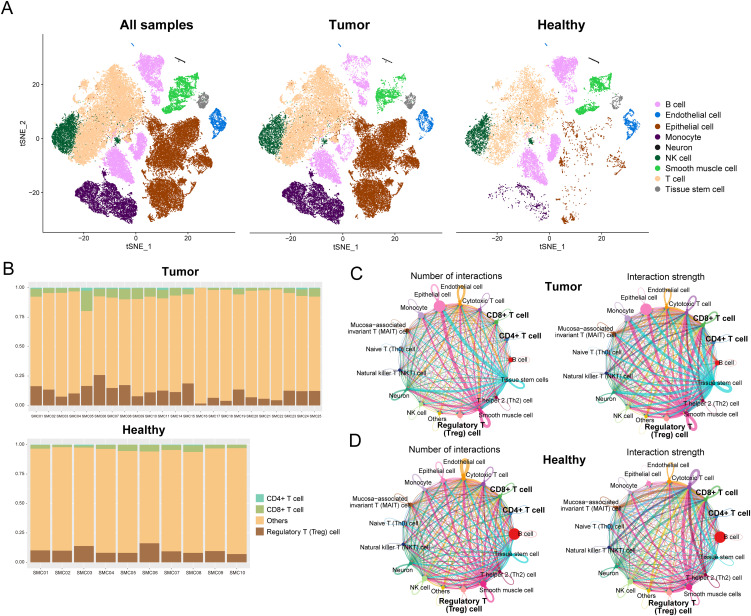
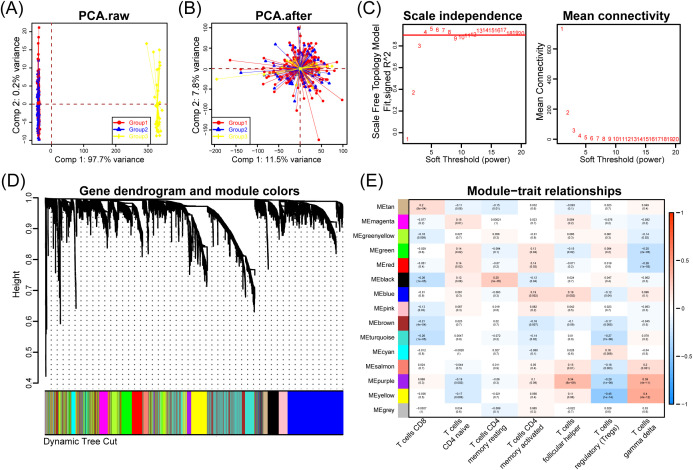
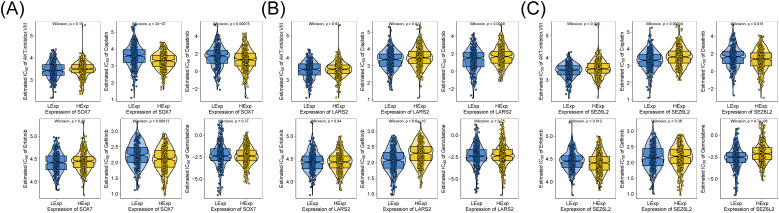
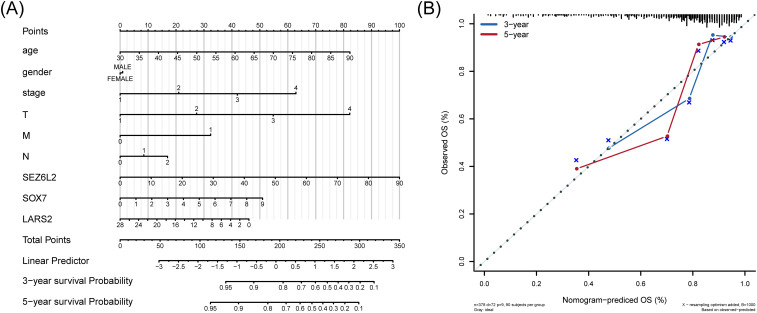
Methods: We performed a single-cell transcriptome analysis of COAD samples from the GEO database. To evaluate immune infiltration in COAD samples, we utilized CIBERSORT and ESTIMATE. Furthermore, we analyzed the correlation between CD8+ T cells and immune infiltration. To analyze COAD expression's quantitative immune cell composition data, we conducted a Weighted Gene Correlation Network Analysis and utilized a deconvolution algorithm. The data for these analyses were obtained from the GEO database. We utilized univariate Cox regression and LASSO analysis to create a prognostic model. The predictive model was assessed through Kaplan-Meier analysis, and a survival prediction nomogram was created. Additionally, we analyzed the correlation between the prognostic model and chemotherapy drug sensitivity. To estimate the expression of hub genes, we employed immunohistochemistry, real-time PCR, and western blot techniques.
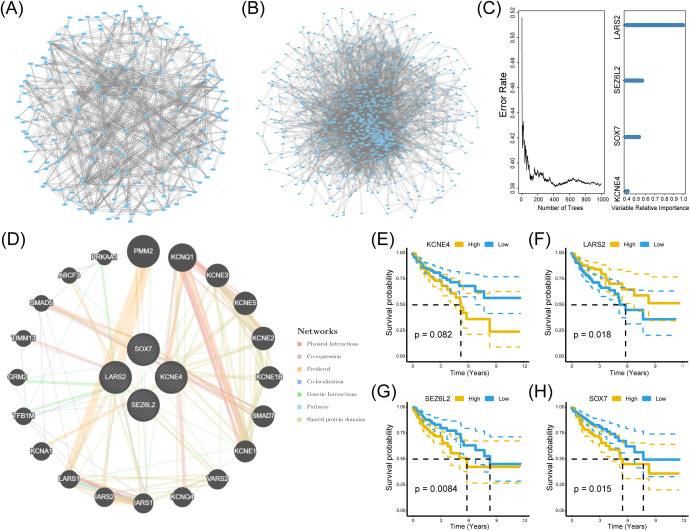
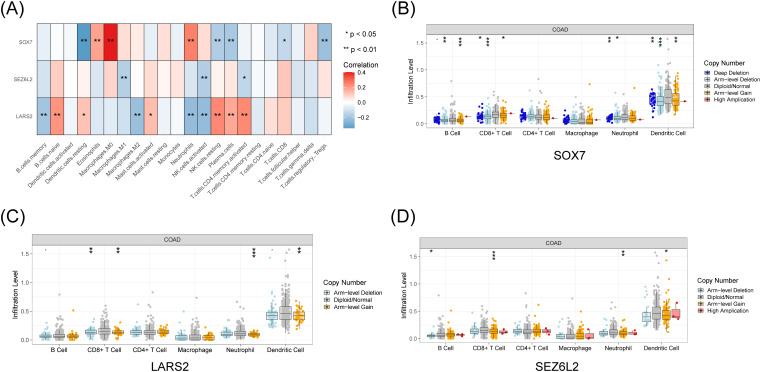
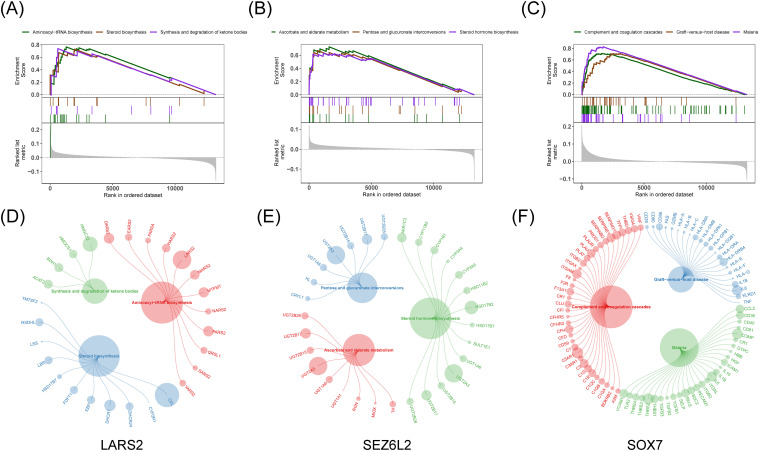
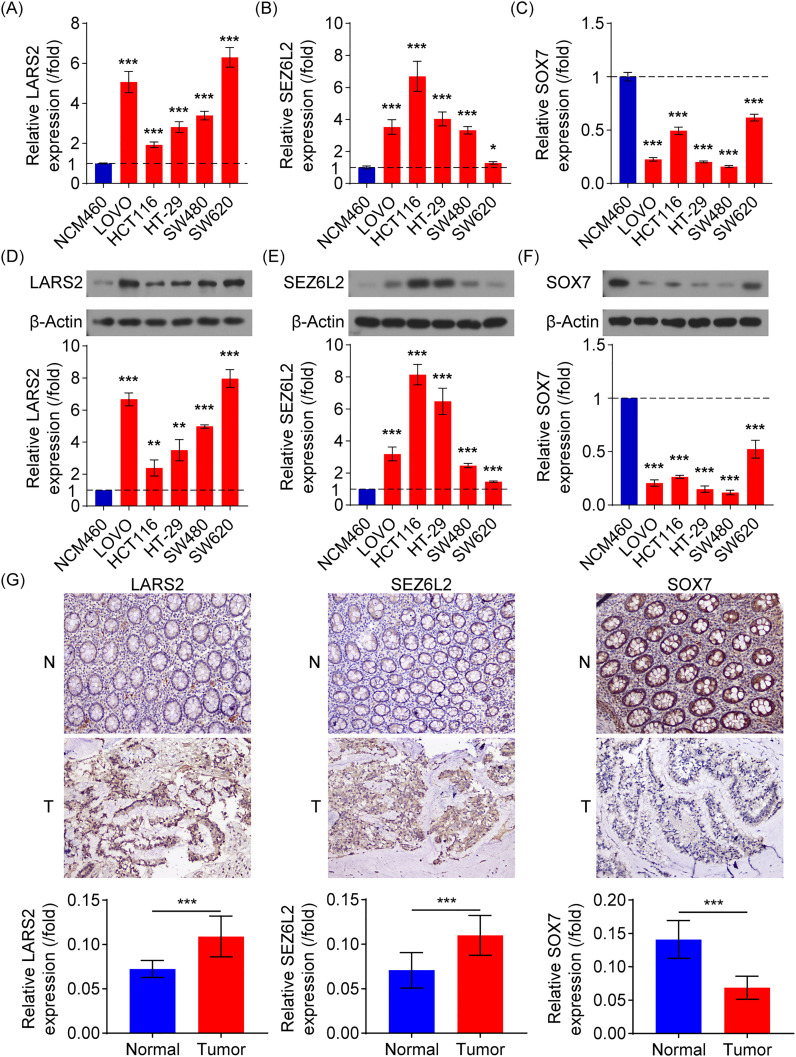
Results: Single-cell transcriptome analysis has indicated a higher prevalence of CD8+ T cells in COAD tumor samples. The connection between COAD and CD8+ T cells was further confirmed by WGCNA and deconvolution analysis using the GEO database. The Protein-Protein Interaction network analysis revealed three hub genes: LARS2, SEZ6L2, and SOX7. A predictive model was subsequently created using LASSO and univariate COX regression, which included these three genes. Two of these hub genes (LARS2 and SEZ6L2) were found to be upregulated in COAD cell lines and tissues, while SOX7 was observed to be downregulated. The prognostic model demonstrated a significant association with CD8+ T cells, suggesting that these genes could serve as potential biomarkers and targets for gene therapy in treating COAD.
Conclusion: This study has identified three key genes associated with CD8+ T cells and the prognosis of COAD, providing new prognostic biomarkers for diagnosing and treating COAD.
Keywords: CD8 + T cells; colon adenocarcinoma; fibrosis; prognostic biomarkers; single-cell RNA sequencing.
Copyright © 2025 Zhang, Sun, Li, Ding, Wang and Liu.
Conflict of interest statement
The authors declare that the research was conducted in the absence of any commercial or financial relationships that could be construed as a potential conflict of interest.
Figures
Similar articles
-
Investigating gene signatures associated with immunity in colon adenocarcinoma to predict the immunotherapy effectiveness using NFM and WGCNA algorithms.Aging (Albany NY). 2024 May 13;16(9):7596-7621. doi: 10.18632/aging.205763. Epub 2024 May 13. Aging (Albany NY). 2024. PMID: 38742936 Free PMC article.
-
DEPDC1B: A novel tumor suppressor gene associated with immune infiltration in colon adenocarcinoma.Cancer Med. 2024 Aug;13(15):e70043. doi: 10.1002/cam4.70043. Cancer Med. 2024. PMID: 39087856 Free PMC article.
-
Identification of a PANoptosis-related long noncoding rna risk signature for prognosis and immunology in colon adenocarcinoma.BMC Cancer. 2025 Apr 10;25(1):662. doi: 10.1186/s12885-025-14021-2. BMC Cancer. 2025. PMID: 40211224 Free PMC article.
-
CD8 + T-Cell-Related Genes: Deciphering Their Role in the Pancreatic Adenocarcinoma TME and Their Effect on Prognosis.Dig Dis Sci. 2025 Jan;70(1):262-284. doi: 10.1007/s10620-024-08715-z. Epub 2024 Nov 27. Dig Dis Sci. 2025. PMID: 39604668
-
Exploration of the relationship between tumor mutation burden and immune infiltrates in colon adenocarcinoma.Int J Med Sci. 2021 Jan 1;18(3):685-694. doi: 10.7150/ijms.51918. eCollection 2021. Int J Med Sci. 2021. PMID: 33437203 Free PMC article.
Cited by
-
A telomere-associated molecular landscape reveals immunological, microbial, and therapeutic heterogeneity in colorectal cancer.Front Mol Biosci. 2025 May 26;12:1615533. doi: 10.3389/fmolb.2025.1615533. eCollection 2025. Front Mol Biosci. 2025. PMID: 40492114 Free PMC article.
References
-
- Kasi PM, Budde G, Krainock M, Aushev VN, Koyen Malashevich A, Malhotra M, et al. . Circulating tumor DNA (ctDNA) serial analysis during progression on PD-1 blockade and later CTLA-4 rescue in patients with mismatch repair deficient metastatic colorectal cancer. J Immunother Cancer. (2022) 10:e003312. doi: 10.1136/jitc-2021-003312 - DOI - PMC - PubMed
MeSH terms
Substances
LinkOut - more resources
Full Text Sources
Research Materials
Miscellaneous