. 2025 Apr 15;135(8):e183513.
doi: 10.1172/JCI183513.

Cell-intrinsic insulin signaling defects in human iPS cell-derived hepatocytes in type 2 diabetes

Affiliations

Cell-intrinsic insulin signaling defects in human iPS cell-derived hepatocytes in type 2 diabetes

Arijeet K Gattu et al. J Clin Invest. .

Abstract

Hepatic insulin resistance is central to type 2 diabetes (T2D) and metabolic syndrome, but defining the molecular basis of this defect in humans is challenging because of limited tissue access. Utilizing inducible pluripotent stem cells differentiated into hepatocytes from control individuals and patients with T2D and liquid chromatography with tandem mass spectrometry-based (LC-MS/MS-based) phosphoproteomics analysis, we identified a large network of cell-intrinsic alterations in signaling in T2D. Over 300 phosphosites showed impaired or reduced insulin signaling, including losses in the classical insulin-stimulated PI3K/AKT cascade and their downstream targets. In addition, we identified over 500 phosphosites of emergent, i.e., new or enhanced, signaling. These occurred on proteins involved in the Rho-GTPase pathway, RNA metabolism, vesicle trafficking, and chromatin modification. Kinome analysis indicated that the impaired phosphorylation sites represented reduced actions of AKT2/3, PKCθ, CHK2, PHKG2, and/or STK32C kinases. By contrast, the emergent phosphorylation sites were predicted to be mediated by increased action of the Rho-associated kinases 1 and 2 (ROCK1/2), mammalian STE20-like protein kinase 4 (MST4), and/or branched-chain α-ketoacid dehydrogenase kinase (BCKDK). Inhibiting ROCK1/2 activity in T2D induced pluripotent stem cell-derived hepatocytes restored some of the alterations in insulin action. Thus, insulin resistance in the liver in T2D did not simply involve a loss of canonical insulin signaling but the also appearance of new phosphorylations representing a change in the balance of multiple kinases. Together, these led to altered insulin action in the liver and identified important targets for the therapy of hepatic insulin resistance.

Keywords: Adult stem cells; Diabetes; Endocrinology; Hepatology; Metabolism.


Conflict of interest statement

Conflict of interest: The authors have declared that no conflict of interest exists.

Figures

Figure 1
Figure 1. Directed differentiation of iHeps.
(A) Schematic of iPS cell differentiation into iHeps using a 4-stage growth factor protocol. The cells were obtained from 8 control individuals and 8 patients with T2D. In the BE, the cells from male donors are represented by squares and cells from female donors by circles. (B and C) Gene expression levels of OCT4, NANOG, ALB, and ASGR1 were determined using RT-qPCR and are plotted on a log10 scale. *P < 0.05, **P < 0.01, and ***P < 0.001, for day 1 versus day 21, by paired, 2-tailed t test. (D) Relative gene expression levels of PCK1 and FASN were determined by RT-qPCR. n = 6–8. *P < 0.05 and **P < 0.01, for basal versus insulin, by paired, 2-tailed t test and unpaired, 2-tailed t test for control plus insulin versus T2D plus insulin. (E) Representative immunoblot analysis of phosphorylation of proteins in cells from 4 control and 4 T2D male donors. Quantification of the data in the bar graphs was normalized to total protein on the right. All data indicate the mean ± SEM. CTL, control; BAS, basal; INS, insulin.
Figure 2
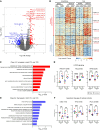
Figure 2. Insulin-regulated phosphosites in control and T2D iHeps.
(A) Volcano plot showing the phosphopeptides increased or decreased in phosphorylation upon insulin stimulation in control iHeps. (B) Hierarchical clustering of phosphosites identified in control and T2D iHeps shows increased and decreased phosphorylation following stimulation with 100 nM insulin for 10 minutes. Rows represent z scores of log2-transformed intensity of phosphosites for each sample labeled in each column. Classes 1A and 2A show equal increases in both control and T2D cells; classes 1B and 2B show impaired signaling in T2D cells; classes 1C and 2C show emergent signaling in T2D iHeps. (C and E) Enrichment analysis of overrepresented Reactome pathways analysis of proteins that showed increased or decreased phosphorylation in both control and T2D cells. (D and F) Quantification of selected phosphosites representing some of the significantly enriched pathways is shown with data from males and females combined. In the panels, the cells from male donors are represented by squares, and female donors are represented by circles, with colors indicating individual donors. n = 8 control donors; n = 6 T2D donors. *P < 0.05, **P < 0.01, ***P < 0.001, and ****P < 0.0001, by paired, 2-tailed t test analysis of raw intensities between groups for basal versus insulin and unpaired and 2-tailed t test between control versus T2D with or without insulin. Data are presented as the mean ± SEM.
Figure 3
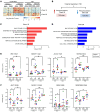
Figure 3. Impaired insulin signaling in T2D iHeps.
(A) Hierarchical clustering showing impaired insulin-regulated phosphosites in control and T2D iHeps. Rows represent normalized log intensity z scores for intensities of the phosphosites for each sample. (B) Schematic showing the number of phosphosites with impaired signaling in T2D iHeps, i.e., phosphorylation events that were lost or had significantly reduced regulation in T2D compared with control cells. Data were separated into phosphosites normally increased by insulin stimulation (left) and sites normally decreased by insulin (right), using data shown in the heatmap in Figure 2B. (C and D) Reactome pathway enrichment of “impaired sites” in T2D iHeps. (E and F) Quantification of exemplary impaired phosphosites normally increased phosphorylation in E or decreased phosphorylation in F. In the panels, the cells from male donors are represented by squares, and those from female donors are represented by circles, with colors indicating individual donors. n = 8 controls; n = 6 T2D. *P < 0.05, **P < 0.01, ***P < 0.001, and ****P < 0.0001, by paired, 2-tailed t test analysis of raw intensities between groups for basal versus insulin, and unpaired, 2-tailed t test between control versus T2D with or without insulin. Data are presented as the mean ± SEM.
Figure 4
Figure 4. Emergent insulin signaling in T2D iHeps upon insulin stimulation.
(A) Hierarchical clustering showing insulin-regulated phosphosites in control and T2D iHeps. Rows represent normalized z scores corresponding phosphosite intensities for each sample. (B) Schematic showing the number of phosphosites with “emergent” signaling in T2D cells, i.e., phosphorylation events that were increased or had significantly reduced regulation in T2D compared with control cells using data from the heatmap in Figure 2B. (C and D) Reactome pathway enrichment of “emergent sites” in T2D iHeps. (E and F) Quantification of exemplary emergent phosphosites normally increased in phosphorylation in C or decreased in phosphorylation in D. In the panels, the cells from male donors are represented by squares and those from female donors by circles, and colors indicate individual donors. Data are presented as the mean ± SEM. n = 8 control; n = 6 T2D. *P < 0.05, **P < 0.01, and ***P < 0.001, by paired, 2-tailed t test of raw intensities between groups for basal versus insulin, and unpaired, 2-tailed t test between control versus T2D with or without insulin.
Figure 5
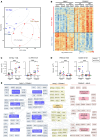
Figure 5. Sexual dimorphism in the basal and insulin-stimulated phosphoproteome.
(A) PCA plot showing separation of the phosphoproteome after adjusting for the surrogate variable by phenotype (control, open circles; T2D, closed circles) and sex (blue, males; red, females) in the basal state. (B) Hierarchical clustering of phosphopeptides after adjusting for the surrogate variable that shows sexual dimorphism (F-test FDR <5%). Rows represent z scores of log2-transformed intensity of phosphosites for each sample in each column. (C and D) Quantification of basal and insulin-stimulated phosphorylation levels of exemplary proteins showing sexual dimorphism. In the panels, the cells from male donors are represented by squares, and those from female donors are represented by circles, with colors indicating individual donors. (E) Signaling map representation of some of the most enriched biological pathways and related proteins that exhibited significantly higher phosphorylation ratios in males (blue) versus females (pink). Data are presented as the mean ± SEM, ***P < 0.001, based on the F-test for sex from unadjusted intensities.
Figure 6
Figure 6. Kinome profiling of predicted kinases related to insulin stimulation and altered in T2D.
(A) Bubble plot showing kinases predicted to be activated in iHeps upon insulin stimulation for control and T2D cells. In the bubble maps, the size and color represent the adjusted P values and frequency factor (FF), respectively, for the significant kinases (adjusted P ≤ 0.1). The black arrows indicate kinases with reduced activity in T2D following insulin stimulation, and the red arrows show the kinase predicted to have increased activity in T2D upon insulin stimulation. (B) Representative immunoblot analysis of phosphorylation of proteins in 4 T2D male donors with and without 100 nM insulin and 10 nM ripasudil. Quantifying the data in bar graphs normalized to a total protein is on the right. In the panels, the cells from male donors are represented by squares, and color indicates individual donors. Data are presented as the mean ± SEM. n = 6–8. *P < 0.05 and ***P < 0.001, by 2-tailed, paired, 2-tailed t test for basal versus insulin, insulin versus insulin+inhibitor, and unpaired, 2-tailed t test for insulin versus inhibitor.
Figure 7
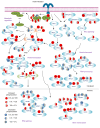
Figure 7. Insulin signaling map showing some critical nodes of phosphoproteome alterations in T2D iHeps.
The signaling map shows exemplary phosphosites detected in the phosphoproteomic analysis. The effect of insulin stimulation is shown in color, with red representing increased phosphorylation and blue representing decreased phosphorylation (a significant difference at P < 0.05). For each site, the stimulation (up or down) in the control iHeps is indicated in the left half of the circle, while that for the T2D iHeps is indicated in the right half of the circle. Each of the phosphosites is color coded according to the effects of insulin on phosphorylation. The pathways shown are representative of those enriched in the Reactome pathways analysis.

Similar articles

Cited by

References

    1. White MF, Kahn CR. Insulin action at a molecular level — 100 years of progress. Mol Metab. 2021;52:101304. doi: 10.1016/j.molmet.2021.101304. - DOI - PMC - PubMed
    1. Reaven GM. Banting Lecture 1988. Role of insulin resistance in human disease. 1988. Nutrition. 1997;13(1):65; discussion 64, 66. doi: 10.1016/S0899-9007(96)00380-2. - DOI - PubMed
    1. Biddinger SB, Kahn CR. From mice to men: insights into the insulin resistance syndromes. Annu Rev Physiol. 2006;68:123–158. doi: 10.1146/annurev.physiol.68.040104.124723. - DOI - PubMed
    1. Eckel RH, et al. Cardiovascular disease in diabetes, beyond glucose. Cell Metab. 2021;33(8):1519–1545. doi: 10.1016/j.cmet.2021.07.001. - DOI - PMC - PubMed
    1. Zimmet P, et al. The metabolic syndrome: a global public health problem and a new definition. J Atheroscler Thromb. 2005;12(6):295–300. doi: 10.5551/jat.12.295. - DOI - PubMed