. 2025 Apr 15;135(8):e175241.
doi: 10.1172/JCI175241.

Virus-associated inflammation imprints an inflammatory profile on monocyte-derived macrophages in the human liver

Affiliations

Virus-associated inflammation imprints an inflammatory profile on monocyte-derived macrophages in the human liver

Juan Diego Sanchez Vasquez et al. J Clin Invest. .

Abstract

Chronic liver injury triggers the activation and recruitment of immune cells, causing antigen-independent tissue damage and liver disease progression. Tissue inflammation can reshape macrophage composition through monocyte replacement. Replacement of tissue macrophages with monocytes differentiating in an inflammatory environment can potentially imprint a phenotype that switches the liver from an immune-tolerant organ to one predisposed to tissue damage. We longitudinally sampled the liver of patients with chronic hepatitis B who had active liver inflammation and were starting antiviral therapy. Antiviral therapy suppressed viral replication and liver inflammation, which coincided with decreased myeloid activation markers. Single-cell RNA-Seq mapped peripheral inflammatory markers to a monocyte-derived macrophage population, distinct from Kupffer cells, with an inflammatory transcriptional profile. The inflammatory macrophages (iMacs) differentiated from blood monocytes and were unique from macrophage found in healthy or cirrhotic liver. iMacs retained their core transcriptional signature after inflammation resolved, indicating inflammation-mediated remodeling of the macrophage population in the human liver that may affect progressive liver disease and immunotherapy.

Keywords: Hepatitis; Hepatology; Immunology; Infectious disease; Macrophages.


Conflict of interest statement

Conflict of interest: SCK is employed by and a stockholder of Gilead Sciences Inc. DM is employed by Fluidigm Inc. DC was formerly employed by Gilead Sciences Inc. and is currently employed by Bristol Myers Squibb. SF receives research funding from Gilead Sciences Inc. and reports compensation from consulting and scientific advising for Gilead Sciences Inc., Abbvie, Janssen Pharmaceuticals, and Assembly Biosciences. AG was formerly employed by and a stockholder of Gilead Sciences Inc. JJF receives research funding from Altimmune, AbbVie, Gilead, Janssen, GSK, Roche, and Vir Biotechnology and reports receiving compensation from consulting and scientific advising for Abbvie, Bluejays, Gilead, Janssen, GSK, Roche, and Vir Biotechnology. KMC serves on the Data Monitoring Committee (DMC) for Virion Therapeutics. JJW is employed by and a stockholder of Gilead Sciences Inc. HLAJ has received grants from Gilead Sciences, GlaxoSmithKline, Janssen, Roche, and Vir Biotechnology Inc. and reports compensation from consulting for Aligos, Gilead Sciences, GlaxoSmithKline, Grifols, Roche, Vir Biotechnology Inc., and Precision Biosciences. AJG receives research funding from Aligos Therapeutics, Bluejay Therapeutics, GSK, Roche, Vir Biotechnology, and EVOQ Therapeutics and reports compensation from consulting and scientific advising for Aligos Therapeutics, Arbutus Biopharma, Assembly Biosciences, Bluejay Therapeutics, Gilead Sciences, GSK, Roche, Vir Biotechnology, and Virion Therapeutics.

Figures

Figure 1
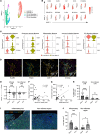
Figure 1. Study design and identification of hepatic cell populations at single-cell resolution from liver FNAs.
(A) HBV DNA and ALT (displayed as fold change [FC] of the ULN) in blood over time, with patients whose samples were sequenced highlighted in red (n = 5). (B) Eleven CHB patients with elevated ALT levels started NUC therapy with TAF (25 mg/d). At baseline and after 12 and 24 weeks of therapy, blood and liver FNAs were collected. Longitudinal FNAs from 5 patients were subjected to scRNA-Seq. (C) Clustering and annotation of 41,829 cells from human livers for 5 patients across 3 time points (baseline, week 12, and week 24). Uniform manifold approximation and projection (UMAP) dimensionality reduction identified 30 clusters. (D) Luminex data from plasma immune profiles of all patients across time. (E) Feature plots depicting single-cell gene expression of individual genes detected by the Luminex assay. (F) Feature plots depicting single-cell gene expression of liver myeloid cells. P values were determined by repeated-measures 1-way ANOVA (*P < 0.05, **P < 0.005, and ***P < 0.001).
Figure 2
Figure 2. Identification and characterization of myeloid cells during liver inflammation.
(A) CD68+ clusters were reclustered using UMAP dimensionality reduction for 5 patients across 3 time points (baseline, week 12, and week 24). (B) Feature plots depicting single-cell gene expression of individual myeloid genes (scale: log-transformed gene expression). (C) Violin plots of macrophage-defining genes. All selected genes have an adjusted P value of less than 0.05. (D) IMC depicting liver macrophages and CD8+ T cell colocalization in inflamed livers of patients with CHB. The portal region is outlined by yellow dotted lines. (E) Enrichment of liver macrophages depicted by the ratio of the portal divided by the lobular cell count/mm2 between inflamed (n = 28) and noninflamed (n = 6) liver tissue sections. Lobular enrichment values were multiplied by –100. P values were determined by a nonparametric Mann-Whitney U test (*P < 0.05, **P < 0.005, and ***P < 0.001). (F and G) Simple correlation analysis between portal CD8+ T cells/mm2 and (F) serum ALT levels and (G) iMacs/mm2 in patients with CHB. (H) Proximity analysis of CD8+ T cells and liver macrophages within 15 μm between inflamed (n = 28) and noninflamed (n = 6) liver tissue sections. P values were determined by nonparametric Wilcoxon test (*P < 0.05, **P < 0.005, and ***P < 0.001). (I) Multiplex IF images showing liver macrophages in inflamed liver of patients with CHB at inflammatory foci and noninflamed regions (n = 4). Original magnification, ×20. (J) Quantification of liver macrophages in inflamed liver of patients with CHB at inflammatory foci and noninflammatory regions. P values were determined by nonparametric Wilcoxon test (*P < 0.05, **P < 0.005, and ***P < 0.001).
Figure 3
Figure 3. Comparison of iMacs during HBV-related inflammation with healthy and cirrhotic livers at the single-cell level.
(A) Clustering of macrophages from healthy (n = 5), cirrhotic (n = 5), and HBV-inflamed (n = 5) human livers using UMAP dimensionality reduction by liver condition. Cells from both healthy and cirrhotic livers were obtained from liver tissue digestion and sequenced with 10x Genomics 3′ version 2, which explains why tissue digestion collected more macrophages than with the FNA approach. (B) Violin plots of macrophage-shared genes across 3 groups. All selected genes have an adjusted P value of less than 0.05. (C) Proportions of liver macrophages across 3 groups for each cluster. (D) Representation of cluster-defining genes; all selected genes have an adjusted P value of less than 0.05.
Figure 4
Figure 4. Analysis of monocyte/macrophage differentiation trajectories during liver inflammation in patients with CHB before antiviral treatment.
(A) iMacs, both CD14+ monocytes and CD16+ monocytes, were reclustered using Seurat during liver inflammation using UMAP dimensionality reduction. (B) Violin plots of CD14+ monocyte–defining genes. All selected genes have an adjusted P value of less than 0.05. (C) Enrichment plot from pathway analysis done on CD14+ monocytes at baseline versus week 24 of TAF treatment. Each vertical line represents a differentially expressed gene belonging to the pathway. (D) Genes with differential expression between clusters were used to generate hypothetical developmental relationships using the Monocle algorithm. (E) Individual clusters along the Monocle trajectory. (F) Gene expression of CD14+ monocyte–defining (first row), iMac-defining (second row), differentiation-defining (third row), and CD16+ monocyte–defining (fourth row) genes along the pseudotime trajectory.
Figure 5
Figure 5. Predicted ligand-receptor interactions during liver inflammation suggest an inflammatory loop between iMacs and CD8+ T cells that will serve to guide in vitro monocyte-to-macrophage differentiation.
(AC) NicheNet analysis of ligand-receptor pairs that induce the differentially expressed gene profile of iMacs during liver inflammation (baseline). (A) Potential ligands, (B) receptors, and (C) target genes that may drive macrophage differentiation and activation at baseline. Only the ligand-receptor interactions that have been previously reported in the literature are included in C. (D) Dot plot of the NicheNet-predicted ligands for all Seurat clusters. (E) Violin plot of the NicheNet-predicted receptors on the iMacs and on both CD14+ monocyte clusters. All selected genes have an adjusted P value of less than 0.05. (F and H) RNAscope images depicting colocalization of ligands from the NicheNet analysis in (F) CD8+ T cells and (H) KCs within inflamed liver of patients with CHB (n = 5). Original magnification, ×10 (left) and ×40 (right). (G and I) Percentage of total (G) CD8+ T cells and (I) KCs that expressed NicheNet-suggested ligands at the area of inflammation in patients with CHB (n = 5). MΦs, macrophages.
Figure 6
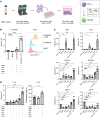
Figure 6. In vitro monocyte-to-macrophage differentiation suggests that type I and II IFN stimulation upregulates key markers from iMacs predicted by scRNA-Seq analysis.
(A) Workflow used for in vitro monocyte-to-macrophage differentiation using NicheNet ligands with a predicted phenotype. (B) Expression of CD16 (FCGR3A) at the transcriptional and protein levels using IL-10 stimulation in addition to NicheNet-predicted ligands. CD16 protein expression was measured from the MFI. (C) Real-time quantitative PCR analyses of the relative FC for mRNA expression in differentiated Macs using individual and combined ligands predicted by NicheNet. (D) Expression of IL-18 at the transcriptional and protein levels using NicheNet ligands. Combined ligands include MCSF, IFN-β, IFN-γ, and ApoE. Mono, monocytes. P values were determined by repeated-measures 1-way ANOVA (*P < 0.05, **P < 0.005, and ***P < 0.001). Results are representative of 5 experiments.
Figure 7
Figure 7. Single-cell-level comparison of iMacs during HBV-related inflammation with healthy livers, cirrhotic livers, and livers of patients with CHB on long-term antiviral therapy.
(A) Clustering of macrophages (Mac) from healthy (n = 5), cirrhotic (n = 5), HBV-inflamed (n = 5), and long-term NUC therapy (n = 5) human livers using UMAP dimensionality reduction. (B) UMAP dimensionality reduction of liver macrophages by liver condition. (C) Comparison of cluster-defining genes for iMacs in the violin plot during liver inflammation and in the absence of liver inflammation. (D) Clustering of CD68+ cells during different stages of CHB using UMAP dimensionality reduction. (E) UMAP dimensionality reduction of CD68+ cells by stage of CHB. (F) Violin plots of iMac-defining genes by stage of CHB. All selected genes have an adjusted P value of less than 0.05.

References

    1. Li Y, et al. Macrophage phenotypes and hepatitis B virus infection. J Clin Transl Hepatol. 2020;8(4):424–431. - PMC - PubMed
    1. Heymann F, et al. Liver inflammation abrogates immunological tolerance induced by Kupffer cells. Hepatology. 2015;62(1):279–291. doi: 10.1002/hep.27793. - DOI - PubMed
    1. Wen Y, et al. Hepatic macrophages in liver homeostasis and diseases—diversity, plasticity, and therapeutic opportunities. Cell Mol Immunol. 2021;18(1):45–56. doi: 10.1038/s41423-020-00558-8. - DOI - PMC - PubMed
    1. Xi S, et al. Activated hepatic stellate cells induce infiltration and formation of CD163+ macrophages via CCL2/CCR2 pathway. Front Med (Lausanne) 2021;8:627927. doi: 10.3389/fmed.2021.627927. - DOI - PMC - PubMed
    1. Sakai M, et al. Liver-derived signals sequentially reprogram myeloid enhancers to initiate and maintain Kupffer cell identity. Immunity. 2019;51(4):655–670. doi: 10.1016/j.immuni.2019.09.002. - DOI - PMC - PubMed

MeSH terms