. 2025 Apr 15;135(8):e164573.
doi: 10.1172/JCI164573.

A small-molecule inhibitor of BCL10-MALT1 interaction abrogates progression of diffuse large B cell lymphoma

Affiliations

A small-molecule inhibitor of BCL10-MALT1 interaction abrogates progression of diffuse large B cell lymphoma

Heejae Kang et al. J Clin Invest. .

Abstract

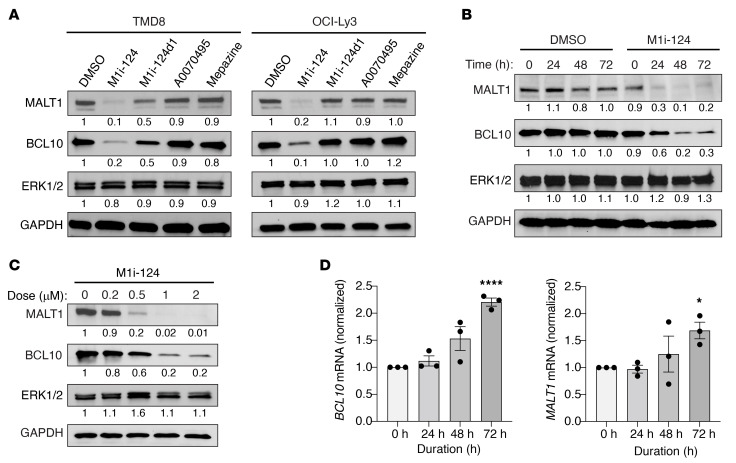
Diffuse large B cell lymphoma (DLBCL) is the most common type of non-Hodgkin lymphoma, and the activated B cell-like subtype (ABC-DLBCL) is associated with particularly poor outcome. Many ABC-DLBCLs harbor gain-of-function mutations that cause inappropriate assembly of the CARMA1-BCL10-MALT1 (CBM) signalosome, a cytoplasmic complex that drives downstream NF-κB signaling. MALT1 is the effector protein of the CBM signalosome such that its recruitment to the signalosome via interaction with BCL10 allows it to exert both protease and scaffolding activities that together synergize in driving NF-κB. Here, we demonstrate that a molecular groove located between two adjacent immunoglobulin-like domains within MALT1 represents a binding pocket for BCL10. Leveraging this discovery, we performed an in silico screen to identify small molecules that dock within this MALT1 groove and act as BCL10-MALT1 protein-protein interaction (PPI) inhibitors. We report the identification of M1i-124 as a first-in-class compound that blocks BCL10-MALT1 interaction, abrogates MALT1 scaffolding and protease activities, promotes degradation of BCL10 and MALT1 proteins, and specifically targets ABC-DLBCLs characterized by dysregulated MALT1. Our findings demonstrate that small-molecule inhibitors of BCL10-MALT1 interaction can function as potent agents to block MALT1 signaling in selected lymphomas, and provide a road map for clinical development of a new class of precision-medicine therapeutics.

Keywords: Immunology; Lymphomas; NF-kappaB; Oncology; Signal transduction; Therapeutics.


Figures

Figure 1
Figure 1. Identification of a BCL10-binding site at the junction of MALT1 Ig1 and Ig2 domains.
(A) Schematic of full-length MALT1 protein highlighting the death domain (DD), immunoglobulin-like domains (Ig), and caspase-like proteolytic domain. Specific residues used to create deletion mutants are indicated. (B and C) Co-IP of HA-tagged MALT1 protein fragments with Myc-tagged BCL10. Myc-tagged RICK and MAVS served as negative controls. (D) SPR curves quantifying the binding of MALT1 protein fragments to immobilized BCL10, with calculated KD values. (E) Co-IP of HA-tagged MALT1(Ig1-2) harboring indicated mutations with Myc-tagged BCL10. (F) Co-IP of either HA-tagged full-length (FL) MALT1 or HA-tagged MALT1(Ig1-2) harboring indicated mutations with Myc-tagged BCL10. (G) The location of each mutation that disrupts binding of MALT1(Ig1-2) to BCL10 in co-IP experiments is highlighted in purple in the published MALT1(Ig1-2) crystal structure (PDB ID: 3K0W). Data in BF are representative of a minimum of 3 independent repeats. All co-IP experiments were performed by expression of proteins in transiently transfected 293T cells.
Figure 2
Figure 2. In silico drug screen identifies M1i-124 as a BCL10-MALT1 PPI inhibitor.
(A) Schematic of in silico drug screen. Three million compounds were screened using LibDock followed by application of Lipinski’s rule of 5 (Ro5) filters, which led to the identification of 9 small-molecule candidates, 7 of which were commercially available. (B) Apoptosis of TMD8 cells, quantified by flow cytometric analysis of annexin V/SYTOX Blue staining, after 6 days of treatment with 1 μM of the 7 candidate molecules from the LibDock screen (mean ± SEM; n = 6). Structure of the only active compound, M1i-124, is shown. (C) Viability of TMD8 cells after 8 days of treatment with 1 μM of the 7 commercially available molecules (mean ± SEM; n = 3). (D) Lead compound, M1i-124, is docked onto the groove between Ig1 and Ig2 near the proposed BCL10-binding site with MALT1(Ig1-2) (PDB ID: 3K0W). (E) SPR analysis of the binding of M1i-124 to immobilized full-length MALT1 confirmed target engagement using a steady-state affinity model. (F) Structures of lead compound, M1i-124, and its analog, M1i-124d1. (G and H) ELISA schematic (G) and analysis (H) showing that M1i-124 and M1i-124d1, but not C741-0547, inhibit the binding of MALT1 to immobilized BCL10 in a dose-dependent manner with indicated IC50 values (mean ± SEM; n = 2–3). For B and C, statistical analyses were performed using a 1-way ANOVA with Dunnett’s multiple-comparison test. ****P < 0.0001.
Figure 3
Figure 3. M1i-124 and M1i-124d1 inhibit MALT1 protease and scaffolding functions in stimulated Jurkat T cells.
(A) Schematic of the CBM complex highlighting the 2 functions of MALT1. MALT1 proteolytic activity cleaves RelB and N4BP1, both of which are analyzed in this study. MALT1 scaffolding activity leads to activation of the IKK complex and phosphorylation of IκB. (B and C) Effect of 1 μM compound pretreatment on CD3/CD28-induced RelB and N4BP1 cleavage in Jurkat T cells. Representative Western blots showing full-length (FL) and cleaved (Cl) proteins are shown. Quantification of the Cl/FL ratio for multiple experiments is plotted. Statistical analyses were performed using 1-way ANOVA and Dunnett’s multiple-comparison test (mean ± SEM; n = 4). (D and E) Effect of 1 μM M1i-124 (D) and 1 μM M1i-124d1 (E) on IKKα/β and ERK phosphorylation following CD3/CD28 stimulation of Jurkat T cells. Representative Western blots are shown along with quantification of the phosphorylated-to-total protein ratios for multiple experiments. Unpaired t test was used to compare each stimulation time point (mean ± SEM; n = 5). (F) IL2 mRNA induction in Jurkat T cells pretreated with 1 μM M1i-124, 1 μM M1i-124d1, or 5 μM mepazine and stimulated with PMA/Iono (mean ± SEM; n = 3). (G) Secreted IL-2 protein measured by ELISA in Jurkat T cells pretreated with M1i-124 or M1i-124d1 and stimulated with PMA/Iono (mean ± SEM; n = 3). For F and G, statistical analyses were performed using 1-way ANOVA and Dunnett’s multiple-comparison test. For all panels, *P < 0.05, **P < 0.01, ***P < 0.001, ****P < 0.0001.
Figure 4
Figure 4. M1i-124 and M1i-124d1 inhibit MALT1 protease and scaffolding functions, and MALT1-dependent cytokine secretion, in ABC-DLBCL cells.
(A and B) Effect of 1 μM compound pretreatment on constitutive RelB cleavage (A) and IκB phosphorylation (B) within TMD8 cells. Representative Western blots are shown along with quantification (mean ± SEM; n = 2). (C) IL6 and IL10 mRNA levels in TMD8 cells treated with 1 μM M1i-124 or M1i-124d1 (mean ± SEM; n = 6). (D) Dose-dependent inhibition of IL-6 and IL-10 secretion from TMD8 cells upon treatment with M1i-124 or M1i-124d1 (mean ± SEM; n = 3). Statistical analyses were performed using 1-way ANOVA and Dunnett’s multiple-comparison test. **P < 0.01, ***P < 0.001, ****P < 0.0001.
Figure 5
Figure 5. M1i-124 treatment leads to loss of BCL10 and MALT1 protein content in ABC-DLBCL cells.
(A) Representative Western blots showing loss of BCL10 and MALT1 proteins, but not ERK1/2 protein, in TMD8 and OCI-Ly3 cells after 72 hours of treatment with 1 μM M1i-124. BCL10 or MALT1 loss was not observed after treatment with 1 μM of the negative control compound A0070495 or mepazine. (B) Representative Western blots showing time-dependent loss of BCL10 and MALT1 in TMD8 cells treated with 1 μM M1i-124. (C) Representative Western blots showing dose-dependent loss of BCL10 and MALT1 proteins in TMD8 cells treated with 1 μM M1i-124. For AC, band quantifications, normalized for GAPDH, are indicated below each blot. (D) Time-dependent change in BCL10 and MALT1 mRNA expression levels with 1 μM M1i-124 treatment in TMD8 cells. Statistical analysis was performed using unpaired t test between 0 hours and 72 hours (mean ± SEM; n = 3). *P < 0.05, ****P < 0.0001.
Figure 6
Figure 6. M1i-124 selectively inhibits the proliferation and survival of MALT1-dependent ABC-DLBCL cells.
(A) Proliferation curves for ABC-DLBCL cell lines (TMD8 and OCI-Ly3) and GCB-DLBCL cell lines (OCI-Ly1 and OCI-Ly7) treated with 1 μM M1i-124, M1i-124d1, or mepazine. Statistical analyses were performed using 1-way ANOVA and Dunnett’s test at day 10–12 (mean ± SEM; n = 3–6). (B) CellTrace Violet dilution/cell division assay for TMD8, OCI-Ly3, and OCI-Ly1 cells treated with 1 μM M1i-124. Cell division profiles were quantified at day 6 and are plotted at right. Statistical analyses were performed using unpaired t tests (mean ± SEM; n = 4). (C) Viability of TMD8, OCI-Ly3, and OCI-Ly1 cells treated with increasing doses of M1i-124. TMD8 cells were slightly more sensitive to M1i-124 than were OCI-Ly3 cells (50% cytotoxic concentration ~0.2 μM vs. ~0.5 μM, respectively). Statistical analyses were performed using 2-way ANOVA with Tukey’s multiple-comparison test (mean ± SEM; n = 3-4). (D) Flow cytometric detection of apoptosis via annexin V/SYTOX Blue staining of DLBCL cells treated with M1i-124 for 8 days (TMD8 and OCI-Ly1 cells) and for 5 days (OCI-Ly3 cells). Representative flow panels are shown with quantification plotted at right (mean ± SEM; n = 9–12). For all panels, *P < 0.05, **P < 0.01, ***P < 0.001, ****P < 0.0001.
Figure 7
Figure 7. M1i-124 displays favorable drug-like properties and has no appreciable in vivo toxicity.
(A) SwissADME modeling of M1i-124 shows minor deviations from the optimal range of physicochemical properties that predict bioavailability. (B) Plasma concentration of M1i-124 over 24 hours in mice treated with 5 mg/kg i.v., 20 mg/kg i.p., or 20 mg/kg p.o. M1i-124. (C) IC50 values for M1i-124–dependent inhibition of cytochrome P450 enzymes. (DG) C57BL/6 mice were treated with either M1i-124 or vehicle control for 28 days. Body weight change from baseline is shown (D), along with results from complete blood count (E) and serum analyses (F). (G) Representative H&E images of liver from mice after 28 days of treatment. Original magnification, ×20. Statistical analyses were performed using unpaired t test (mean ± SEM; n = 6–9). **P < 0.01.
Figure 8
Figure 8. M1i-124 inhibits ABC-DLBCL lymphoma tumor growth in a xenograft mouse model.
(A and B) M1i-124–dependent inhibition of TMD8 xenograft growth in NOD-SCID mice, as assessed by tumor volume (A) and terminal tumor weight (B) (mean ± SEM; n = 8). (C) Effect of M1i-124 on mouse weight (mean ± SEM; n = 8). (D) IL6, IL10, IRF4, NFKBID, NFKBIZ, and TNFA mRNA levels in TDM8 tumor xenografts 24 hours after the final treatment with M1i-124 or DMSO control (mean ± SEM; n = 7–8). (E) M1i-124–dependent inhibition of OCI-Ly3 (ABC-DLBCL line) versus OCI-Ly1 (GCB-DLBCL line) xenograft growth in NSG mice, as assessed by tumor volume (mean ± SEM; n = 7–8). For all panels, statistical analyses were performed using unpaired t test. *P < 0.05, ***P < 0.001, ****P < 0.0001.
Figure 9
Figure 9. Model for BCL10-MALT1 interaction and the role of M1i-124 in disrupting CBM assembly.
This model proposes that the nature of the interaction between BCL10 and MALT1 differs depending on the state of cell activation. In unstimulated lymphocytes, an interaction between the MALT1 tandem Ig domains and the BCL10 C-terminus is responsible for maintaining dimeric complexes. Upon antigen receptor stimulation, or in cells harboring mutations that cause constitutive stimulation, the BCL10-MALT1 dimers undergo a conformational shift resulting in a repositioning of the interaction as the proteins are inserted into a growing CBM filament. In this setting, a MALT1 DD–BCL10 CARD interaction is responsible for maintaining the oligomeric complex. Treatment of cells with M1i-124 causes disruption of the resting dimeric complexes and destabilization of the BCL10 and MALT1 proteins. With time, even in ABC-DLBCL cells harboring activating mutations, the turnover of filaments and lack of dimeric BCL10-MALT1 substrate to generate new filaments result in suppressed CBM activity.

References

    1. Sehn LH, Salles G. Diffuse large B-cell lymphoma. N Engl J Med. 2021;384(9):842–858. doi: 10.1056/NEJMra2027612. - DOI - PMC - PubMed
    1. Roschewski M, et al. Diffuse large B-cell lymphoma-treatment approaches in the molecular era. Nat Rev Clin Oncol. 2014;11(1):12–23. doi: 10.1038/nrclinonc.2013.197. - DOI - PMC - PubMed
    1. Wright GW, et al. A probabilistic classification tool for genetic subtypes of diffuse large B cell lymphoma with therapeutic implications. Cancer Cell. 2020;37(4):551–568. doi: 10.1016/j.ccell.2020.03.015. - DOI - PMC - PubMed
    1. Schmitz R, et al. Genetics and pathogenesis of diffuse large B-cell lymphoma. N Engl J Med. 2018;378(15):1396–1407. doi: 10.1056/NEJMoa1801445. - DOI - PMC - PubMed
    1. Chapuy B, et al. Molecular subtypes of diffuse large B cell lymphoma are associated with distinct pathogenic mechanisms and outcomes. Nat Med. 2018;24(5):679–690. doi: 10.1038/s41591-018-0016-8. - DOI - PMC - PubMed

MeSH terms

Substances