. 2025 Jun;12(21):e2416066.
doi: 10.1002/advs.202416066. Epub 2025 Apr 15.

Nanoneedle-Based Electroporation for Efficient Manufacturing of Human Primary Chimeric Antigen Receptor Regulatory T-Cells

Affiliations

Nanoneedle-Based Electroporation for Efficient Manufacturing of Human Primary Chimeric Antigen Receptor Regulatory T-Cells

Ningjia Sun et al. Adv Sci (Weinh). 2025 Jun.

Abstract

Regulatory T cells (Tregs) play a crucial role in moderating immune responses offering promising therapeutic options for autoimmune diseases and allograft rejection. Genetically engineering Tregs with chimeric antigen receptors (CARs) enhances their targeting specificity and efficacy. With non-viral transfection methods suffering from low efficiency and reduced cell viability, viral transduction is currently the only viable approach for GMP-compliant CAR-Treg production. However, viral transduction raises concerns over immunogenicity, insertional mutagenesis risk, and high costs, which limit clinical scalability. This study introduces a scalable nanoneedle electroporation (nN-EP) platform for GMP-compatible transfection of HLA-A2-specific CAR plasmids into primary human Tregs. The nN-EP system achieves 43% transfection efficiency, outperforming viral transduction at multiplicity of infection 1 by twofold. Importantly, nN-EP preserves Treg viability, phenotype and proliferative capacity. HLA-A2-specific CAR-Tregs generated using nN-EP show specific activation and superior suppressive function compared to polyclonal or virally transduced Tregs in the presence of HLA-A2 expressing antigen presenting cells. These findings underscore the potential of nN-EP as a GMP-suitable method for CAR-Treg production, enabling broader clinical application in immune therapies.

Keywords: CAR‐T; electroporation; nanoneedle; nanoscale electroporation; non‐viral transfection; regulatory T cells; tregs.


Conflict of interest statement

The authors declare no conflict of interest.

Figures

Figure 1
Figure 1
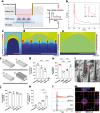
Interfacing Tregs with Nanoneedles. a) Restriction map of the pLNT/SFFV_A2 CAR‐eGFP plasmid used for Treg transfection with nanoneedles. b) Schematic diagram detailing the components of the A2‐28 ζ CAR‐eGFP gene. c) Representative dot plots showing isolated Tregs purity with 91.8% CD4+CD25+ population in Quadrant 2 (Q2). d) Quantification of live cells, CD4+ and CD25+ populations obtained from GMP isolation compared to unstained samples (Isotype). Data presented as mean ± standard deviation (SD), n = 3, two‐way ANOVA followed by Sidak's multiple comparisons test. p‐values are indicated above the bars. (e) SEM image of the nanoneedle arrays. Scale bar: 1 µm. f) Fluorescence image displaying uniform distribution of Cy5‐labeled plasmid across nanoneedles (top view). Scale bar: 10 µm. g) Quantification of Tregs viability after 1 and 12 h on nanoneedles with (nN CF) or without centrifugation (nN) compared to Tregs centrifuged on flat silicon wafers (Flat CF) as control. Data presented as mean ± standard deviation (SD), n = 3, two‐way ANOVA. h) False‐coloured SEM image showing interfacial interactions between Treg and nanoneedle surface 1 h post‐interfacing. Scale bar: 1 µm. i) False‐colored SEM image showing recovered spherical shape of Treg and dissolved porous nanoneedle 12 h post‐interfacing. Scale bar: 1 µm. j) Quantification of transfection efficiency by centrifugation‐assisted nanoinjection compared to untreated control. Data presented as mean ± standard deviation (SD), n = 3. Unpaired t test. p‐value is indicated above the bars.
Figure 2
Figure 2
Nanoneedle electroporation of Tregs. a) Schematic illustration of the nN‐EP‐system setup. Not to scale. b) Plot of electric field intensity across a vertical line at the interface starting from the nanoneedle (red trace) or flat electrode (blue trace) side to the cell side. Nanoneedle tip = 8.45 kV cm−1. Control planar surface = 1.38 kV cm−1. c) Electric field (kV/cm) intensity plot at the nanoneedle tip for the nN‐EP‐system at 10 V, scale bar = 50 nm. d) Electric field (kV/cm) intensity plot for the nN‐EP‐system at 10 V, scale bar = 5 µm. e) Electric field (kV/cm) intensity plot for a flat silicon electrode at 10 V, scale bar = 5 µm. f) Stepwise assembly of the nN‐EP‐system: Stage 1 shows the bottom nanoneedle holder with three square holding areas for holding the nanoneedle chips; Stage 2 shows the nanoneedle chips positioned within the holding areas; Stage 3 shows the PDMS spacer layered over the nanoneedle chips; and Stage 4 shows the fully assembled nanoneedle electroporation well. g) Quantification of cell viability across electroporation conditions. Data presented as mean ± standard deviation (SD), n = 3, one‐way ANOVA followed by Tukey's multiple comparison test. p‐values are indicated above the bars. h) Quantification of cell viability as a function of electroporation buffer. Data presented as mean ± SD, n = 3, one‐way ANOVA followed by Tukey's multiple comparison test. p‐values are indicated above the bars. i) SEM image of the Au‐coated nanoneedles. Red arrows indicating gold deposition. Scale bar: 1 µm. j) Viability comparison for cells electroporated under optimized conditions using flat silicon chips (Flat), silicon nanoneedles (nN‐EP Si) and Au‐coated silicon nanoneedles (nN‐EP Au) compared with untreated control (Untreated). Data presented as mean ± SD, n = 3, one‐way ANOVA. k) Quantification of Cy5+ Tregs population indicative of CAR construct delivery for each electroporation condition. Data presented as mean ± SD, n = 3, one‐way ANOVA followed by Tukey's multiple comparison test. p‐values are indicated above the bars. l) Representative flow cytometry histogram showing Cy5 fluorescence intensity distribution for each electroporation condition compared to untreated control. m) Representative confocal microscopy image showing Cy5+ Treg on nN loaded with Cy5‐tagged plasmid (Red). Treg nucleus was stained with DAPI (Blue). Scale bar: 5 µm.
Figure 3
Figure 3
Efficient Tregs transfection via nanoneedle electroporation. a) Quantification of Tregs viability following treatment by lipofection (Lipo), transferrin‐PEI transfection (Tf‐PEI), lentiviral transduction at a multiplicity of infection of 1 (Lentiviral), nN‐EP Si, nN‐EP Au and bulk electroporation (BEP) compared to Untreated Tregs. Data presented as mean ± SD, n = 3, one‐way ANOVA followed by Tukey's multiple comparison test. p‐values are indicated above the bars. b) Quantification of Treg transfection efficiency for each treatment. Data presented as mean ± SD, n = 3, one‐way ANOVA followed by Tukey's multiple comparison test. p‐values are indicated above the bars. c) Representative flow cytometry histograms of the distribution of eGFP expression for each treatment.
Figure 4
Figure 4
Tregs maintain proliferation and phenotype following nanoneedle electroporation. a) Representative flow cytometry histograms showing CTV fluorescence intensity distribution in Tregs treated by BEP, nN‐EP Si, and nN‐EP Au from Day 0 to Day 4; untreated Tregs served as positive control, and unstained Tregs (Isotype) as negative control. b) Growth curve for A2‐CAR transfected Tregs. Growth curve of untreated, nN‐EP Au, and BEP Tregs over the course of 16 days. Data presented as mean ± SD, n = 3, two‐way ANOVA followed by Tukey's multiple comparison test. p‐values comparing BEP and Untreated groups are indicated above the bars. There were no significant differences between nN‐EP Au and Untreated groups. c) Flow cytometry histograms of characteristic Treg markers (CD4, CD25, CD127, and FoxP3), suppression markers (PD‐1 and CTLA‐4), and the proliferation marker Ki‐67. d) Quantification of the expression levels of the Tregs markers in (c). Data presented as mean ± SD, n = 3, two‐way ANOVA followed by Tukey's multiple comparison test. p‐values are indicated above the bars.
Figure 5
Figure 5
Nanoneedle electroporated Tregs selectively suppress effector T‐Cells (Teffs). a) Quantification of CD69 expression for A2‐Tregs generated from nN‐EP Au and Lentiviral transduction compared to Untreated Tregs after 24 h of co‐culture with HLA‐A2+ and HLA‐A2 B‐LCLs. Data presented as mean ± standard deviation (SD), n = 3, two‐way ANOVA followed by Tukey's multiple comparison test. p‐values are indicated above the bars. b) Flow cytometry histograms showing the distribution of CD69 expression representative of the activation state of Tregs in each group. c) Quantification of the suppressive capacity of untreated Tregs, nN‐EP Au A2‐Tregs and Lentiviral A2‐Tregs when co‐cultured with HLA‐A2+ B‐LCLs. Data presented as mean ± standard deviation (SD), n = 3, two‐way ANOVA followed by Tukey's multiple comparison test. p‐values between nN‐EP Au and Untreated groups (black), and between nN‐EP Au and Lentiviral groups (blue) are indicated above the bars. d) Quantification of the suppressive capacity of untreated Tregs, nN‐EP Au A2‐Tregs and Lentiviral A2‐Tregs when co‐cultured with HLA‐A2 B‐LCLs. Data presented as mean ± standard deviation (SD), n = 3, two‐way ANOVA.

References

    1. Neelapu S. S., Locke F. L., Bartlett N. L., Lekakis L. J., Miklos D. B., Jacobson C. A., Braunschweig I., Oluwole O. O., Siddiqi T., Lin Y., N. Engl. J. Med. 2017, 377, 2531. - PMC - PubMed
    1. Sterner R. C., Sterner R. M., Blood Cancer J. 2021, 11, 69. - PMC - PubMed
    1. Raffin C., Vo L. T., Bluestone J. A., Nat. Rev. Immunol. 2020, 20, 158. - PMC - PubMed
    1. Cassano A., Chong A. S., Alegre M. L., Front. Transplant. 2023, 2, 1217065. - PMC - PubMed
    1. Giganti G., Atif M., Mohseni Y., Mastronicola D., Grageda N., Povoleri G. A., Miyara M., Scottà C., Eur. J. Immunol. 2021, 51, 39. - PubMed

MeSH terms

LinkOut - more resources