

Root restriction accelerates genomic target identification in quinoa under controlled conditions
- PMID: 40231839
- PMCID: PMC11998636
- DOI: 10.1111/ppl.70223
Root restriction accelerates genomic target identification in quinoa under controlled conditions
Abstract
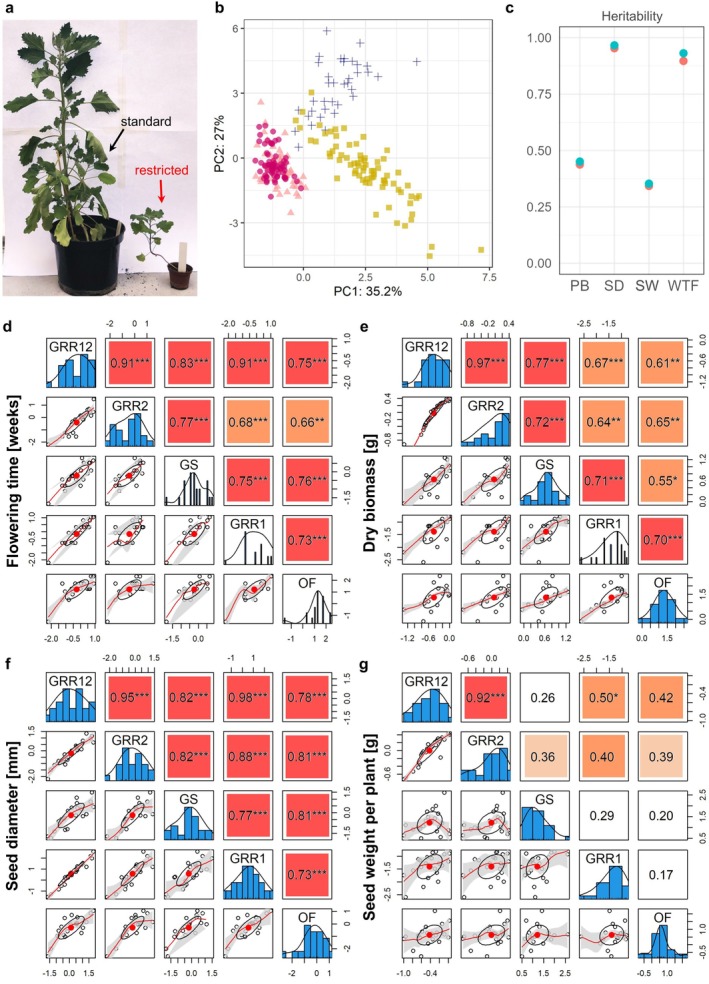
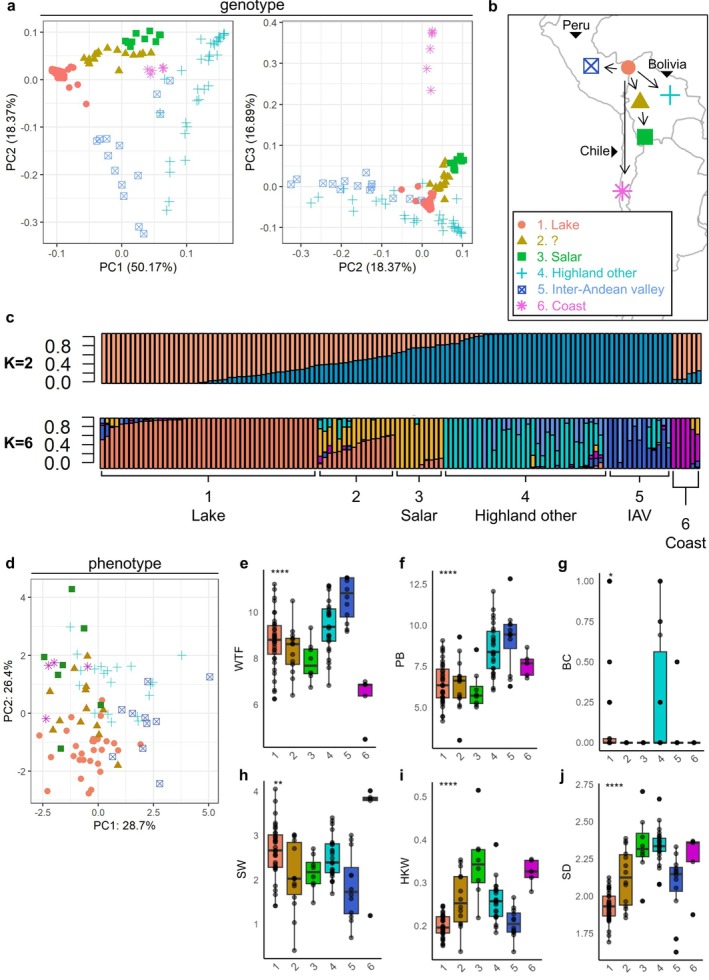
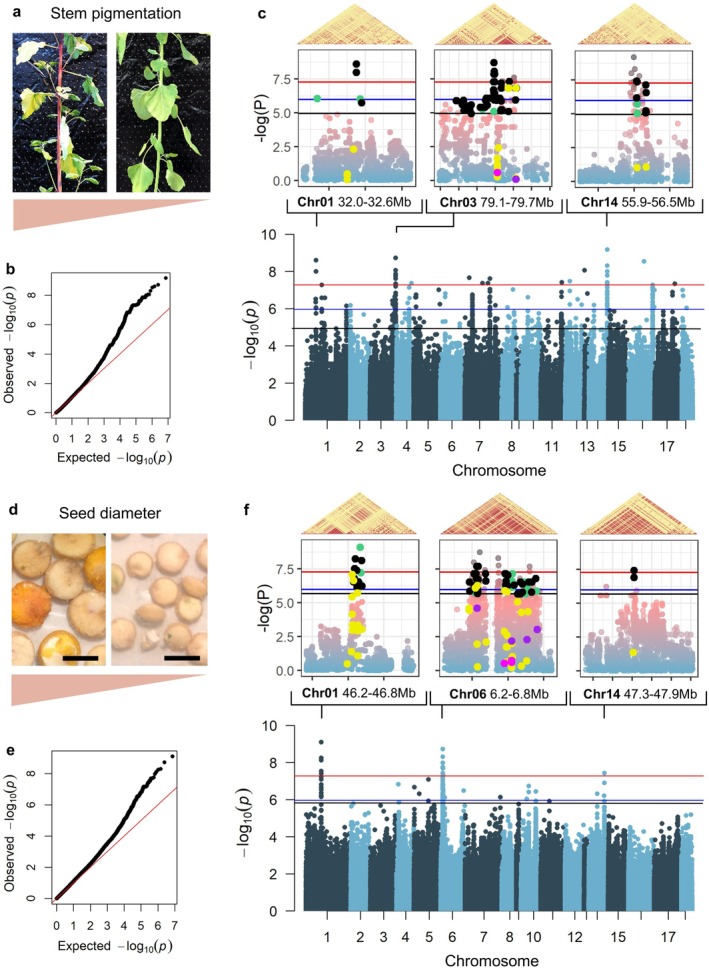
Quinoa (Chenopodium quinoa) is a nutritious and resilient crop that displays a high genetic and phenotypic variation. As the popularity of this crop increases, there is a growing need to integrate classic and modern breeding tools to favor its improvement. We tested root restriction as a method to reduce plant size and enable high-throughput phenotypic screening of large sets of quinoa plants under controlled conditions. We verified how increasing root restriction does not affect the prediction of field behavior with respect to other standard greenhouse cultivation procedures. We then combined the phenotypic information obtained with our root restriction system with whole-genome re-sequencing data to characterize a quinoa diversity panel of 100 accessions and showed that phenotypic data obtained from root-restricted plants provide real insights into quinoa genetics. Finally, we carried out a genome-wide association study (GWAS) and identified a previously described locus for betalain biosynthesis, as well as other candidate loci linked to betalain biosynthesis and seed size. Overall, we showed that a phenotyping system based on root restriction can aid the identification of genomic targets in quinoa, which can complement and inform field trials for certain traits. This work supports further breeding and faster improvement of quinoa.
© 2025 The Author(s). Physiologia Plantarum published by John Wiley & Sons Ltd on behalf of Scandinavian Plant Physiology Society.
Figures
Similar articles
-
Genome-wide association study in quinoa reveals selection pattern typical for crops with a short breeding history.Elife. 2022 Jul 8;11:e66873. doi: 10.7554/eLife.66873. Elife. 2022. PMID: 35801689 Free PMC article.
-
Genomic basis of seed colour in quinoa inferred from variant patterns using extreme gradient boosting.Plant Biotechnol J. 2024 May;22(5):1312-1324. doi: 10.1111/pbi.14267. Epub 2024 Jan 11. Plant Biotechnol J. 2024. PMID: 38213076 Free PMC article.
-
Developing Chenopodium ficifolium as a potential B genome diploid model system for genetic characterization and improvement of allotetraploid quinoa (Chenopodium quinoa).BMC Plant Biol. 2021 Oct 25;21(1):490. doi: 10.1186/s12870-021-03270-5. BMC Plant Biol. 2021. PMID: 34696717 Free PMC article.
-
Progress on genomics and locus of important agronomic traits in Chenopodium quinoa.Yi Chuan. 2022 Nov 20;44(11):1009-1027. doi: 10.16288/j.yczz.22-289. Yi Chuan. 2022. PMID: 36384994 Review.
-
[Domesticated cultivation and genetic breeding of Chenopodium quinoa].Yi Chuan. 2019 Nov 20;41(11):1009-1022. doi: 10.16288/j.yczz.19-177. Yi Chuan. 2019. PMID: 31735704 Review. Chinese.
Cited by
-
Genetic and environmental influences on fatty acid and tocopherol diversity in quinoa germplasm.Front Plant Sci. 2025 May 15;16:1541895. doi: 10.3389/fpls.2025.1541895. eCollection 2025. Front Plant Sci. 2025. PMID: 40453342 Free PMC article.
References
-
- Aguilar, P. C. , & Jacobsen, S.‐E. (2003). Cultivation of quinoa on the Peruvian altiplano. Food Reviews International, 19(1–2), 31–41. 10.1081/FRI-120018866 - DOI
-
- Al‐Naggar, A. M. M. , El‐Salam, R. M. A. , Badran, A. E. E. , & El‐Moghazi, M. M. A. (2017). Heritability and interrelationships for agronomic, physiological and yield traits of quinoa (Chenopodium quinoa Willd.) under elevated water stress. Archives of Current Research International, 10(3), 1–15. 10.9734/ACRI/2017/37215 - DOI
-
- Asseng, S. , Ewert, F. , Martre, P. , Rötter, R. P. , Lobell, D. B. , Cammarano, D. , Kimball, B. A. , Ottman, M. J. , Wall, G. W. , White, J. W. , Reynolds, M. P. , Alderman, P. D. , Prasad, P. V. V. , Aggarwal, P. K. , Anothai, J. , Basso, B. , Biernath, C. , Challinor, A. J. , De Sanctis, G. , … Zhu, Y. (2015). Rising temperatures reduce global wheat production. Nature Climate Change, 5(2), Article 2. 10.1038/nclimate2470 - DOI
MeSH terms
Grants and funding
LinkOut - more resources
Full Text Sources
Research Materials
