. 2025 May 20;10(5):e0153024.
doi: 10.1128/msystems.01530-24. Epub 2025 Apr 15.

Proteomic characterization of Mycobacterium tuberculosis subjected to carbon starvation

Affiliations

Proteomic characterization of Mycobacterium tuberculosis subjected to carbon starvation

Kaylyn L Devlin et al. mSystems. .

Abstract

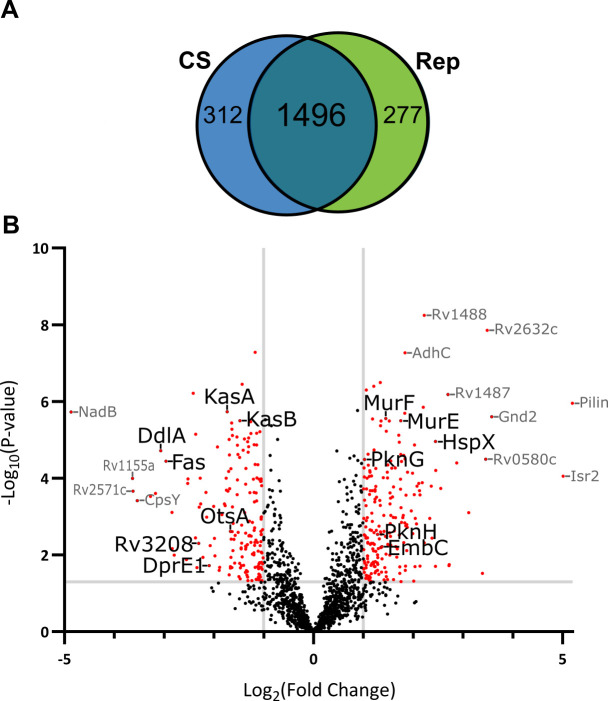
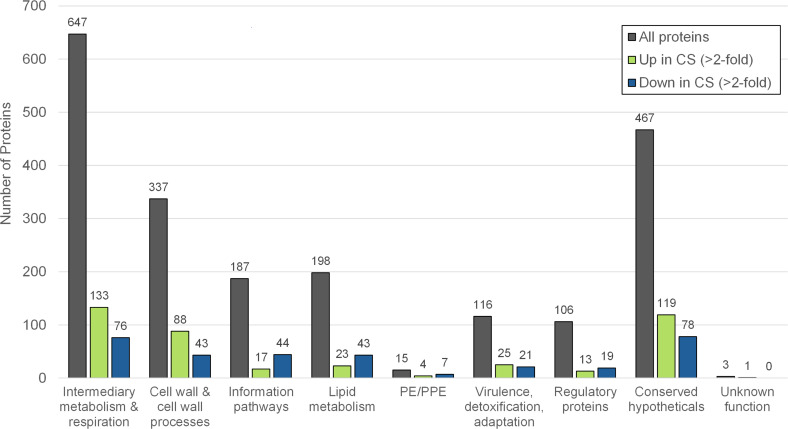
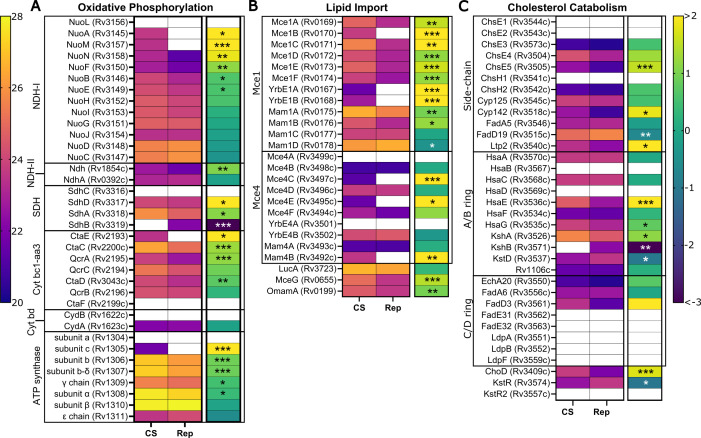
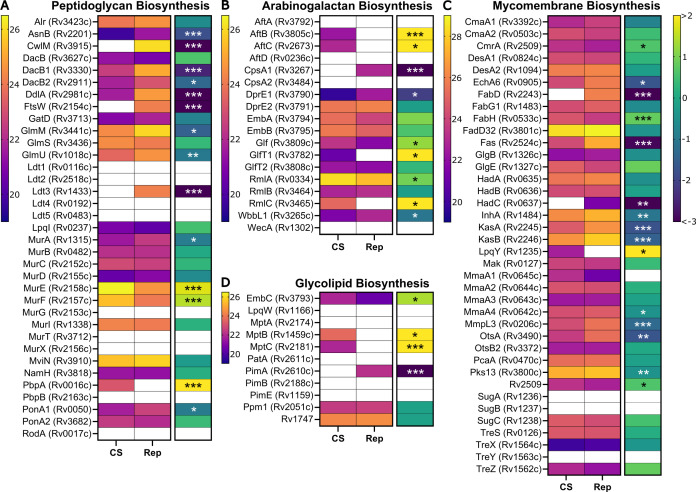
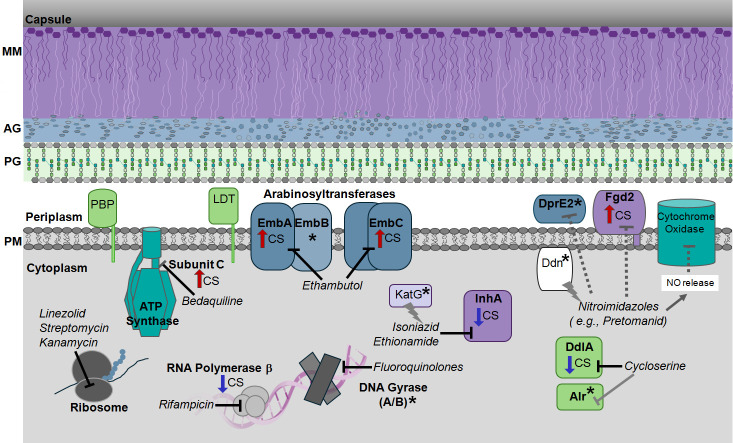
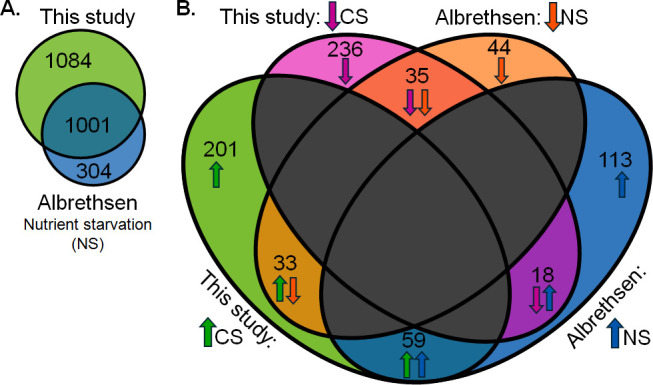
Mycobacterium tuberculosis (Mtb) is the causative agent of tuberculosis (TB), the leading cause of infectious disease-related deaths worldwide. TB infections present on a spectrum from active to latent disease. In the human host, Mtb faces hostile environments, such as nutrient deprivation, hypoxia, and low pH. Under these conditions, Mtb can enter a dormant, but viable, state characterized by a lack of cell replication and increased resistance to antibiotics. Dormant Mtb poses a major challenge to curing infections and eradicating TB globally. We subjected Mtb mc26020 (ΔlysA and ΔpanCD), a double auxotrophic strain, to carbon starvation (CS), a culture condition that induces growth stasis and mimics environmental conditions associated with dormancy in vivo. We provide a detailed analysis of the proteome in CS compared to replicating samples. We observed extensive proteomic reprogramming, with 36% of identified proteins significantly altered in CS. Many enzymes involved in oxidative phosphorylation and lipid metabolism were retained or more abundant in CS. The cell wall biosynthetic machinery was present in CS, although numerous changes in the abundance of peptidoglycan, arabinogalactan, and mycolic acid biosynthetic enzymes likely result in pronounced remodeling of the cell wall. Many clinically approved anti-TB drugs target cell wall biosynthesis, and we found that these enzymes were largely retained in CS. Lastly, we compared our results to those of other dormancy models and propose that CS produces a physiologically distinct state of stasis compared to hypoxia in Mtb.IMPORTANCETuberculosis is a devastating human disease that kills over 1.2 million people a year. This disease is caused by the bacterial pathogen Mycobacterium tuberculosis (Mtb). Mtb excels at surviving in the human host by entering a non-replicating, dormant state. The current work investigated the proteomic changes that Mtb undergoes in response to carbon starvation, a culture condition that models dormancy. The authors found broad effects of carbon starvation on the proteome, with the relative abundance of 37% of proteins significantly altered. Protein changes related to cell wall biosynthesis, metabolism, and drug susceptibility are discussed. Proteins associated with a carbon starvation phenotype are identified, and results are compared to other dormancy models, including hypoxia.

Keywords: Mycobacterium tuberculosis; antibiotic resistance; dormancy; infectious disease; metabolism; proteomics.


Conflict of interest statement

The authors declare no conflict of interest.

Figures

Fig 1
Fig 1
Comparison of proteins identified in CS versus Rep conditions. (A) Venn diagram of proteins identified in n ≥ 3 samples in CS or Rep conditions. (B) Volcano plot of proteins found in CS and Rep conditions. Red dots highlight proteins significantly different in abundance between groups with P ≤ 0.05 (ANOVA) and a log2 fold change (FC) in CS relative to Rep ≥ 1.0 (more abundant) or ≤−1.0 (less abundant). Proteins identified in only one group (n ≥ 3 in group A and n ≤ 1 in group B) were not included in the volcano plot due to the inability to calculate an FC. A subset of proteins discussed here is labeled (black font).
Fig 2
Fig 2
Protein functional classification. Bar chart displaying the distribution of identified proteins across functional categories. The distribution of proteins found in either Rep or CS conditions is shown in gray (all proteins). The distribution of differentially abundant proteins in CS relative to Rep is shown in green (up in CS) and blue (down in CS). Categories were defined and assigned based on Mycobrowser (35) Mtb H37Rv (release 5) annotation.
Fig 3
Fig 3
Regulation of energy metabolism in CS versus Rep conditions. Heat maps of mean protein intensities (left map, warm scale) and corresponding log2 fold change (right map, cool scale) in CS vs Rep groups. Proteins are identified by UniProt name (locus ID) and are grouped by function: oxidative phosphorylation (A), lipid import (B), and cholesterol catabolism (C). Scale bars are applicable across all corresponding maps. The fold change of proteins identified in only one group (group A: n ≥ 3, group B: n ≤ 1) was set to the respective maximum value. Asterisks denote significance of the difference in mean intensity between CS and Rep (*: P ≤ 0.05, **: P ≤ 0.01, and ***: P ≤ 0.001). A white box indicates absence of value.
Fig 4
Fig 4
Changes in cell wall biosynthesis in response to CS. Heat maps of mean protein intensities (left map, warm scale) and corresponding log2 fold change (right map, cool scale) in CS vs Rep groups. Proteins are identified by Uniprot name (locus ID) and grouped by function: PG biosynthesis (A), AG biosynthesis (B), MM biosynthesis (C), and glycolipid biosynthesis (D). Fold change scale bar is applicable across all corresponding maps. The fold change of proteins identified in only one group (group A: n ≥ 3 and group B: n ≤ 1) was set to the respective maximum value. Asterisks denote significance of the difference in mean intensity between CS and Rep (*: P ≤ 0.05, **: P ≤ 0.01, and ***: P ≤ 0.001). A white box indicates absence of value.
Fig 5
Fig 5
The targets of clinically approved TB drugs are present in Mtb under CS and Rep conditions. Drug targets involved in cell wall biosynthesis are color-coded by functional localization: MA/MM (purple), AG (blue), and PG (light green). Proteins involved in transcription and translation are shown in gray. Other relevant drug targets are shown in teal. Altered protein levels in CS are indicated by arrows: red (more abundant) and dark blue (less abundant). An asterisk indicates no significant change in protein levels between CS and Rep. Drug names are italicized. Nitroimidazoles have a complex mechanism and target more than one pathway, as indicated.
Fig 6
Fig 6
Comparative analysis of proteins associated with carbon or nutrient starvation. (A) Total shared and unique Mtb proteins were identified in at least three replicates (our study) or two replicates (23, 23) of either starved or Rep conditions. (B) Comparison of differentially expressed proteins between the two studies. There were 59 proteins that were upregulated (FC > 2), and 35 proteins were downregulated (FC > 2) in CS in both studies; 51 proteins were discordant between the studies.

Update of

Similar articles

References

    1. World Health Organization . 2024. Global tuberculosis report 2024. Geneva
    1. Stop TB Partnership . 2022. Global plan to end TB 2023-2030
    1. Chung ES, Johnson WC, Aldridge BB. 2022. Types and functions of heterogeneity in mycobacteria. Nat Rev Microbiol 20:529–541. doi:10.1038/s41579-022-00721-0 - DOI - PMC - PubMed
    1. Dartois VA, Rubin EJ. 2022. Anti-tuberculosis treatment strategies and drug development: challenges and priorities. Nat Rev Microbiol 20:685–701. doi:10.1038/s41579-022-00731-y - DOI - PMC - PubMed
    1. Grant SS, Kawate T, Nag PP, Silvis MR, Gordon K, Stanley SA, Kazyanskaya E, Nietupski R, Golas A, Fitzgerald M, Cho S, Franzblau SG, Hung DT. 2013. Identification of novel inhibitors of nonreplicating Mycobacterium tuberculosis using a carbon starvation model. ACS Chem Biol 8:2224–2234. doi:10.1021/cb4004817 - DOI - PMC - PubMed

LinkOut - more resources