. 2025 Jun;12(21):e2415846.
doi: 10.1002/advs.202415846. Epub 2025 Apr 15.

Asprosin-FABP5 Interaction Modulates Mitochondrial Fatty Acid Oxidation through PPARα Contributing to MASLD Development

Affiliations

Asprosin-FABP5 Interaction Modulates Mitochondrial Fatty Acid Oxidation through PPARα Contributing to MASLD Development

Yuan-Yuan Yu et al. Adv Sci (Weinh). 2025 Jun.

Abstract

Alterations in liver metabolism play a pivotal role in the development and progression of metabolic dysfunction-associated steatotic liver disease (MASLD). Asprosin is reported to be released from white adipose tissue during fasting and targets the liver. However, the role of asprosin, especially from organs other than adipose tissue, in MASLD remains poorly understood. These findings demonstrate that plasma asprosin levels are significantly elevated in MASLD patients and animal models. Additionally, asprosin expression increased in the liver of MASLD mice. Hepatocyte-specific overexpression of asprosin impairs mitochondrial fatty acid β-oxidation (FAO), whereas its knockdown not only enhances FAO in mice but also compensates for fenofibrate's limitations in MASLD treatment. Mechanistic investigations reveal that the interaction of asprosin with FABP5 facilitates its abnormal nuclear localization, and asprosin directly bound to and inhibites peroxisome proliferator-activated receptor elements (PPREs), which negatively regulated PPARα transcriptional activity, and disrupts hepatic FAO pathways. GalNAc-siRNAs targeting hepatic FABP5 ameliorate hepatic steatosis. These findings reveal that the secretory adipose factor asprosin is expected to act as a biological marker for early clinical diagnosis and prognostic evaluation of MASLD. Moreover, targeting hepatic asprosin gene inhibition and GalNAc-siRNAs to inhibit hepatic FABP5 both offer potential therapeutic benefits in the treatment of MASLD.

Keywords: FABP5; PPARα; asprosin; fenofibrate; hepatic steatosis; insulin resistance; mitochondrial fatty acid β‐oxidation.


Conflict of interest statement

The authors declare no conflict of interest.

Figures
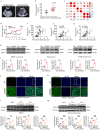
Figure 1
Figure 1
Asprosin levels increases in MASLD patients and animals. a) Ultrasound images of the liver in healthy controls and MASLD patients. b) Detection of plasma asprosin levels in healthy controls and MASLD patients. n = 21, 33 in each group. c) Heatmap for correlation analysis of asprosin and GGT, TC, TG, ALT, AST levels in plasma of healthy controls and MASLD patients. n = 52 in each group. d) Weekly measurements of serum asprosin levels in mice fed a high‐fat, high‐cholesterol, high‐fructose (HFHFHC) diet over a period of 12 weeks. n = 6 in each group. e–g) Analysis of the correlation between asprosin levels and liver enzymes (ALT, AST and GGT) in mouse serum under high‐fat, high‐cholesterol, and high‐fructose diet model. n = 7, 8 in each group. h,i) Levels of hepatic asprosin protein and mRNA in different MASLD models: APOE(‐/‐) mice on a HFHFHC diet for 21 weeks, hamsters on HFHFHC diet for 4 weeks, and C57BL/6J mice on HFHFHC diet for 12 weeks. n = 4, 5 in each group. j,k) Immunofluorescence detection of asprosin in the livers of various groups of mice. n = 4 in each group. (l‐m) Different concentrations of FFA induce changes in asprosin protein and mRNA in HepG2 cells and primary hepatocytes; Changes in asprosin levels in supernatants of HepG2 cells and primary hepatocytes. HepG2 cells and primary hepatocytes were stimulated with free fatty acids (FFA, 200 µM, 250 µM) for 24 h. n = 6 in each group. Scale bar: 100 µm. HFHFHC, high‐fat, high‐cholesterol, high‐fructose; ALT, aspartate aminotransferase; AST, alanine aminotransferase; GGT, gamma‐glutamyl transferase; ND, normal diet; FFA, free fatty acids. Statistical analysis was performed with one‐way ANOVA. *p < 0.05 versus ND, **p < 0.01 versus ND, ***p < 0.001 versus ND, **p < 0.01 versus BSA, ***p < 0.001 versus BSA, #p < 0.05 versus FFA (200 µmol/L), ##p,< 0.01 versus FFA (200 µmol/L).
Figure 2
Figure 2
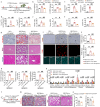
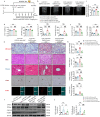
Hepatic asprosin deficiency alleviates hepatic steatosis. a) Schematic illustration of the experimental design employed to assess the impact of hepatic asprosin deficiency on hepatic steatosis. b) Liver weight, and LW/BW of C57BL/6J mice from different groups. n = 8 in each group. c) AAV‐shAsprosin reduced the elevated serum transaminase level induced by HFCDAA feeding in C57BL/6J mice. n = 6–8 in each group. d) The total cholesterol and triglyceride content of the livers. n = 8 in each group. e,f) The serum TG, TC, LDL, HDL levels. n = 8 in each group. g,h) Representative histological sections stained with Oil Red O, hematoxylin and eosin (H&E), and Masson's trichrome. Quantitative analyses of Oil Red O positive areas, non‐alcoholic fatty liver disease activity score (NAS), and detection of liver hydroxyproline content are shown. n = 6–8 in each group. i,j) Immunohistochemical staining for CD68 and immunostaining staining for F4/80. Quantitative of CD68 positive areas and mean fluorescence intensity of F4/80 staining are shown. n = 5–7 in each group. k) AAV‐shAsprosin changed the expression of genes involved in lipid metabolism. n = 6–8 in each group. l) Schematic illustration of the experimental design employed to assess the impact of adipose asprosin deficiency on hepatic steatosis. m) Representative histological sections stained with Oil Red O, hematoxylin, and eosin (H&E). n = 6 in each group. n) The serum ALT, AST levels. n = 6 in each group. LW/BW, liver weight/body weight, TC, total cholesterol; TG, triglyceride; ALT, aspartate aminotransferase; AST, alanine aminotransferase; HDL‐C, high‐density lipoprotein cholesterol; LDL‐C, low‐density lipoprotein cholesterol; ND, normal diet; HFCDAA, high fat, methionine choline deficiency diet. Scale bar for Oil Red O, H&E, Masson's trichrome staining, and CD68 immunohistochemical: 50 µm, for F4/80 immunostaining: 100 µm. Statistical analysis was performed with one‐way ANOVA. **p < 0.01 versus ND+AAV‐shNC. #p < 0.05, ##p < 0.01 versus HFCDAA+AAV‐shNC.
Figure 3
Figure 3
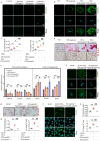
Asprosin induces lipid accumulation in hepatocytes. a) Primary hepatocytes were treated with different concentrations of asposin recombinant protein (r‐Asprosin, 20, 50, 100 ng mL−1) for 24 h. n = 6 in each group. b,d) Representative images of Oil Red O and BODIPY staining in primary hepatocytes and HepG2 cells. Cells were transfected with an asprosin overexpression plasmid for 24 h, followed by stimulation with 250 µM free fatty acids (FFA) for another 24 h. n = 5, 6 in each group. c) Detection of TC, TG content in primary hepatocytes. n = 6 in each group. e) Quantitative PCR was performed to determine the hepatic mRNA levels of genes related to fatty acid metabolism. n = 5, 6 in each group. f,g) Effects of asprosin knockdown on lipid accumulation in primary hepatocytes induced by 250 µM FFA, evidenced by reduced Oil Red O and BODIPY staining. n = 6 in each group. h) Detection of TC, TG content in primary hepatocytes. n = 6 in each group. i) BODIPY staining in HepG2 cells. j) Detection of TC, TG content in HepG2 cells. n = 6 in each group. Scale bar for Oil red O staining: 20 µm or 50 µm, for BODIPY staining: 10 µm or 20 µm. Statistical analysis was performed with one‐way ANOVA. *p < 0.05 versus NC, **p < 0.01 versus NC, #p < 0.05 versus FFA (250 µmol/L), ##p < 0.01 versus FFA (250 µmol/L).
Figure 4
Figure 4
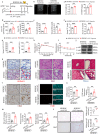
Asprosin exacerbates HFHFHC diet induced hepatic steatosis, hyperlipidemia, and increases insulin resistance. a) Schematic illustration of the experiment design. b) Representative Doppler ultrasound images showing the oblique diameter of the right lobe of the liver. n = 11 in each group. c) Liver weight, and LW/BW of APOE( −/−) mice from different groups. n = 9 in each group. d–g) The serum LDL, HDL, TG, TC, AST, ALT levels and liver TC, TG levels. n = 7–10 in each group. h,i) Results from Oral Glucose Tolerance Tests (OGTT) and Insulin Tolerance Tests (ITT) performed at weeks 10 and 11, respectively, to evaluate glucose metabolism and insulin sensitivity. n = 6 in each group. j) Western blot analysis depicting levels of phosphorylated AKT (p‐AKT) and total AKT in the livers of insulin‐stimulated APOE(‐/‐) mice on the HFHFHC diet. n = 6 in each group. k–l) Histological examination of liver biopsies stained with Oil Red O, hematoxylin and eosin (H&E), and Masson's trichrome, alongside immunohistochemical staining for CD68 and immunostaining for F4/80. n = 6, 7 in each group. m,n) The statistics of Oil Red O‐positive areas, non‐alcoholic fatty liver disease activity score (NAS), quantitative of F4/80 mean fluorescence intensity of liver, and CD68 positive areas in liver sections are shown. The detection of liver hydroxyproline of liver content is shown. n = 6, 7 in each group. o) H&E staining images of epididymal adipose and subcutaneous white fat tissue and quantification of epididymal adipose tissue area. n = 5, 6 in each group. Scale bar for Oil Red O, H&E, Masson's trichrome, CD68 immunohistochemical staining: 50 µm, for F4/80 immunostaining: 100 µm; iv, Intravenous injection; HFHFHC, high fat, high cholesterol, high fructose. Statistical analysis was performed with one‐way ANOVA. *p < 0.05, **p < 0.01, ***p < 0.001 versus HFHFHC+AAV‐NC.
Figure 5
Figure 5
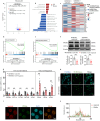
Transcriptome analysis reveals asprosin enrichment pathway. a–c) RNA sequencing conducted on liver tissues from mice fed an HFHFHC diet and treated with either AAV‐NC (control) or AAV‐Asprosin (asprosin overexpression). Top 15 pathways identified through KEGG enrichment analysis showing significant alterations. Heatmap depicting the expression levels of genes involved in fatty acid metabolism, demonstrating differential expression between groups. d,e) Gene Set Enrichment Analysis (GSEA) analysis of PPAR signaling pathway, fatty acid degradation pathway, indicating shifts in gene expression profiles related to lipid metabolism in response to asprosin modulation. f) Western blot detection of PPARα and CPT1A protein levels in liver. n = 6 in each group. g) Hepatic mRNA levels of genes related to lipid metabolism. n = 5–8 in each group. h) HepG2 cells underwent FAOBlue staining to assess β‐oxidation capacity. n = 5 in each group. i) Triple immunofluorescence (IF) staining for Asprosin (red), PPARα (green), and nuclei (DAPI, blue) in HepG2 cells. n = 6 in each group. j) Co‐localization analysis of PPARα with asprosin. Scale bar: 5 µm. Statistical analysis was performed with one‐way ANOVA. **p < 0.01 versus HFHFHC+AAV‐NC. HFHFHC, high fat, high cholesterol, high fructose.
Figure 6
Figure 6
FABP5 assists asprosin in the nuclear translocation, and asprosin targets and modulates the PPARα‐binding PPRE consensus motif in CPT1A. a) Purification and interaction analysis of asprosin. His‐tagged asprosin protein was purified and subjected to a pull‐down assay in HepG2 cells to capture interacting proteins. Mass spectrometry identified specific peptides indicating high binding affinity between asprosin and FABP5. b,c) Interaction validation in primary hepatocytes and HepG2 cells. Cells were transfected with His‐asprosin, and immunoprecipitation (IP) using an anti‐His antibody confirmed the interaction between FABP5 and asprosin. n = 5 in each group. d) Asposin promoted the nuclear translocation of FABP5 in HepG2 cells. HepG2 cells were transfected with His‐asprosin before Western blot analyses. Statistical data of FABP5 protein expression. n = 5 in each group. e) Immunofluorescence visualization of nuclear translocation. HepG2 cells transfected with His‐asprosin were stained for FABP5 (green) and nuclei with DAPI (blue). n = 6 in each group. f) Asposin knock‐down reduces FABP5 nuclear translocation. Statistical data of FABP5 protein expression. n = 4 in each group. g) FABP5 knock‐down reduces asprosin nuclear translocation. n = 4, 5 in each group. h) Purification of asprosin protein and capture of interacting proteins using a His pull‐down assay in HepG2 cells, followed by KEGG pathway analysis of the identified proteins. i) Asprosin inhibited the expression of PPARα and its target gene CPT1A. Primary hepatocytes were treated with asprosin overexpression plasmid for 48 h and then analysed by Western blot. n = 8, 10 in each group. j) Asprosin reduced the expression and activity of PPARα, but cotransfected PPARα expression vector restored them. n = 6 in each group. k) Impact of PPARα‐targeting siRNA (siPPARα) on PPARα expression, and its effect on gene regulation by asprosin. Western blot analysis in primary hepatocytes transfected with siRNA or PPARα vectors. Western blot analysis of PPARα and CPT1A. n = 5, 6 in each group. l) Fenofibrate, a PPARα agonist, could not restore the effects of asprosin in primary hepatocytes treated with asprosin. After treatment with asprosin overexpression plasmid for 24 h, primary hepatocytes were treated with fenofibrate (100 µM) for 24 h. The protein level of PPARα was analyzed by Western blot. n = 6 in each group. m) Western blot analysis of the impact of FABP5 knockdown on asprosin's inhibition of PPARα and CPT1A protein expression in HepG2 cells. n = 4‐8 in each group. n,o) Primary hepatocytes and HepG2 cells were transfected with His‐asprosin. Immunoprecipitation (IP) was performed with an anti‐His antibody. IP assays showed that PPARα interacted with His‐asprosin in primary hepatocytes. n = 6 in each group. p) DNA‐binding activity of PPARα assessed using a transcription factor assay kit in HepG2 cells. (#ab133107, Abcam, USA). n = 3‐5 in each group. q). Chromatin immunoprecipitation (ChIP) analysis of asprosin binding to the PPARα promoters in primary hepatocytes and HepG2 cells. qPCR was performed with primers specific for the PPARα binding motifs. n = 5 in each group. r) HEK 293T cells were transfected with indicated plasmids. Cells were harvested after 24 h of transfection and luciferase activity was measured. n = 3 in each group. s,t) Chromatin immunoprecipitation (ChIP) analysis of PPARα binding to the CPT1A promoters in primary hepatocytes and HepG2 cells. qPCR was performed with primers specific for the CPT1A binding motifs. n = 4 in each group. u) HEK 293T cells were transfected with the indicated plasmids. Cells were harvested 24 h after transfected and the luciferase activity was measured. n = 6 in each group. v) Asprosin decreases mitochondrial oxygen consumption in HepG2 cells. ASP, asprosin. Statistical analysis was performed with one‐way ANOVA. n = 4–6 in each group. Statistical plot of basal, ATP‐linked and maximal respiration after treatment with asprosin overexpression plasmid for 48 h. Asp, asprosin. Scale bar: 50 µm. Statistical analysis was performed with one‐way ANOVA. *p < 0.05, **p < 0.01, ***p < 0.001 versus NC or control; ##p < 0.01 versus IgG or Flag‐PPARα+CPT1A‐luc; &p < 0.01 versus OE‐PPARα‐ChIP.
Figure 7
Figure 7
GalNAc‐siRNAs targeting hepatic FABP5 alleviate hepatic steatosis induced by HFHFHC diet. a) Schematic illustration of the experiment design, with an overview of GalNAc‐siFABP5 injection time points. b,c) The oblique diameter of the right lobe of the liver was detected by Doppler ultrasound. n = 6 in each group. d) The liver weight, and LW/BW of C57BL/6J mice from different groups. n = 6 in each group. e,f). Serum ALT, AST, TC, and TG levels in C57BL/6J mice. n = 6 in each group. g) Representative histological images of liver biopsies stained with Oil Red O, H&E, Masson's trichrome, F4/80 immunostaining, and CD68 immunohistochemical. n = 6 in each group. h) The statistics of Oil Red O‐positive areas, NAFLD activity score (NAS), quantitative of F4/80 and CD68 positive cells in liver. n = 6 in each group. i,j) Western blot detection of CPT1A, PPARAα, FABP5, asprosin protein levels in liver. n = 3,4 in each group. Scale bar for Oil Red O, H&E, Masson's trichrome, CD68 immunohistochemical staining: 50 µm, for F4/80 immunostaining: 100 µm. Statistical analysis was performed with one‐way ANOVA. *p < 0.05, **p < 0.01, ***p < 0.001 versus AAV‐shNC+GalNAc‐mus‐siNC. #p < 0.05, ##p < 0.01 versus AAV‐Asprosin+GalNAc‐mus‐siNC. ns, no significance.
Figure 8
Figure 8
AAV‐shAsprosin enhances the effects of fenofibrate in HFCDAA‐fed mice. a) Western blot detection of PPARα and CPT1A protein levels in liver. n = 6 in each group. b–o) Statistical images of the oblique diameter of the right lobe of the liver detected by Doppler ultrasound; The body weight, liver weight, and LW/BW of C57BL/6J mice; The TC and TG content of livers; Plasma biochemical tests. Statistical analysis was performed with one‐way ANOVA. n = 6‐8 in each group. ALT, aspartate aminotransferase; AST, alanine aminotransferase; AKP, alkaline phosphatase; TC, total cholesterol; TG, triglyceride; HDL‐C, high‐density lipoprotein cholesterol; LDL‐C, low‐density lipoprotein cholesterol; LW/BW, liver weight/body weight; ND, normal diet; HFCDAA, high fat, methionine choline deficiency diet. Statistics of Oil Red O positive areas, NAFLD activity score (NAS), quantitative of F4/80 and CD68 positive area in the liver are shown. n = 6, 7 in each group. g) C57BL/6 J mice were fed on HFCDAA and treated with the indicated AAVs. After C57BL/6 J mice were fed on HFCDAA for 4 weeks, mice were injected with vehicle or fenofibrate (100 mg kg−1) for 4 weeks. Representative images, the oblique diameter of the right lobe of the liver detected by Doppler ultrasound, Oil Red O, H&E, and Masson's trichrome. n = 6–8 in each group. h) Representative images of liver biopsies stained for F4/80 immunofluorescence and CD68 immunohistochemistry. p,q) Schematic diagram of primary hepatocytes extracted for subsequent experiments. Primary hepatocytes, isolated from the livers of treated mice, underwent FAOBlue staining to assess β‐oxidation capacity, and BODIPY staining to evaluate lipid deposition. The statistics of quantification were evaluated by FAOBlue staining and BODIPY staining. n = 4 in each group. HFCDAA, high fat, methionine choline deficiency diet. r) q‐PCR was performed to use the hepatic mRNA levels of genes related to fatty acid metabolism. n = 5,6 in each group. Scale bar for Oil Red O, H&E, Masson's trichrome staining, and CD68 immunohistochemistry staining: 50 µm, for FAOBlue and BODIPY staining: 10 µm, Scale bar for F4/80 immunofluorescence staining: 100 µm. Statistical analysis was performed with one‐way ANOVA. **p < 0.01,***p < 0.001 versus AAV‐NC+ND; # p < 0.05; ##p < 0.01 versus AAV‐NC+HFCDAA; &&p < 0.01 versus AAV‐NC+Fenofibrate+HFCDAA; ns, not significant. ND, normal diet; HFCDAA, high fat, methionine choline deficiency diet.

References

    1. Lazarus J. V., Newsome P. N., Francque S. M., Kanwal F., Terrault N. A., Reply R. M. E., Hepatology 2024, 79, E93. - PubMed
    1. Kalligeros M., Vassilopoulos A., Vassilopoulos S., Victor D. W., Mylonakis E., Noureddin M., Clin. Gastroenterol. Hepatol. 2023, 22, 1330 - PubMed
    1. Targher G., Byrne C. D., Tilg H., Gut 2024, 73, 691. - PubMed
    1. Phoolchund A. G. S., Khakoo S. I., Cancers (Basel) 2024, 16, 259 - PMC - PubMed
    1. Han S. K., Baik S. K., Kim M. Y., Clin Mol Hepatol 2023, 29, S5. - PMC - PubMed

MeSH terms

LinkOut - more resources