. 2025 Apr 1;66(4):36.
doi: 10.1167/iovs.66.4.36.

Proliferator-Activated Receptor Alpha Inhibits Abnormal Extracellular Matrix Accumulation and Maintains Energy Metabolism in Late-Onset Fuchs Endothelial Corneal Dystrophy

Affiliations

Proliferator-Activated Receptor Alpha Inhibits Abnormal Extracellular Matrix Accumulation and Maintains Energy Metabolism in Late-Onset Fuchs Endothelial Corneal Dystrophy

Xiaoqi Li et al. Invest Ophthalmol Vis Sci. .

Abstract

Purpose: Fuchs endothelial corneal dystrophy (FECD) is the most common corneal endothelial dystrophy and guttae are crucial in causing progressive loss of corneal endothelium. This study aimed to find a way to inhibit the formation of guttae in FECD.

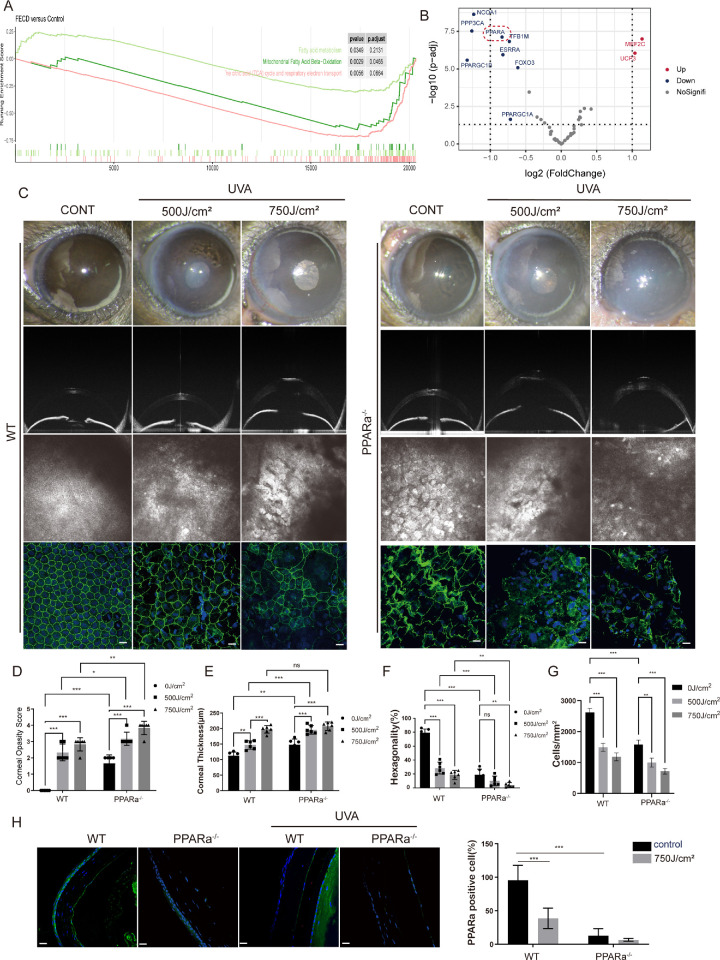
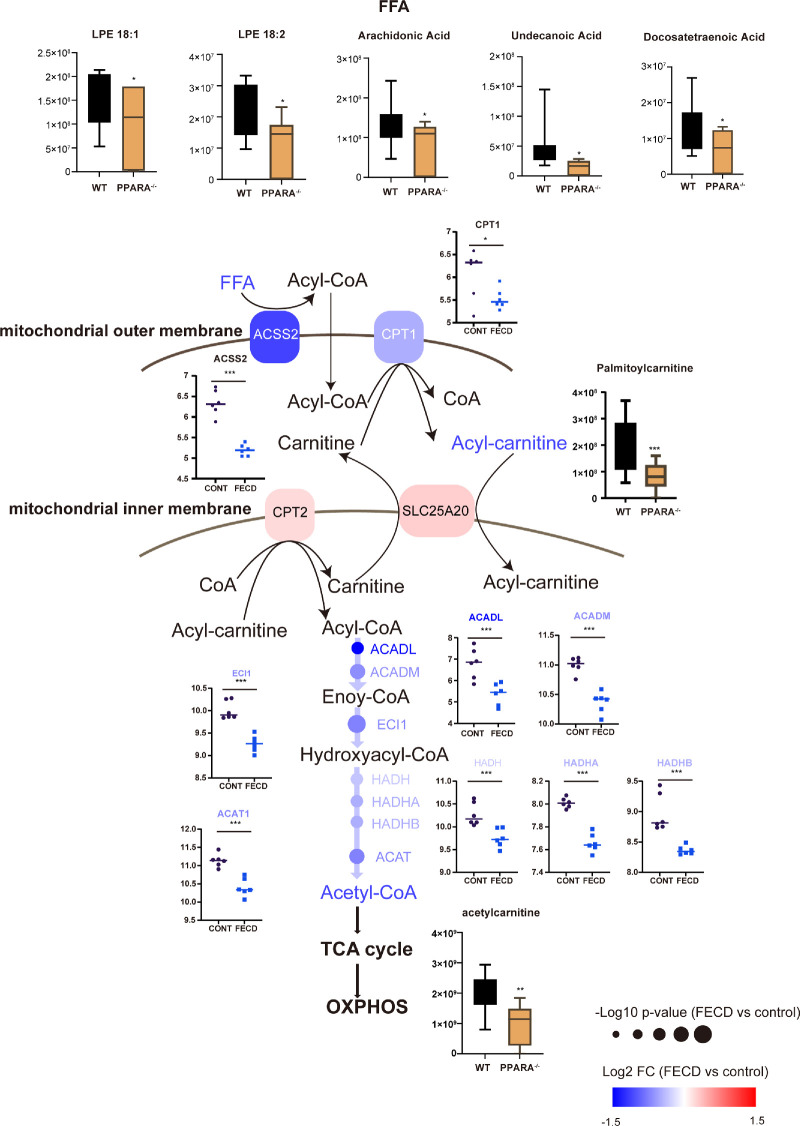
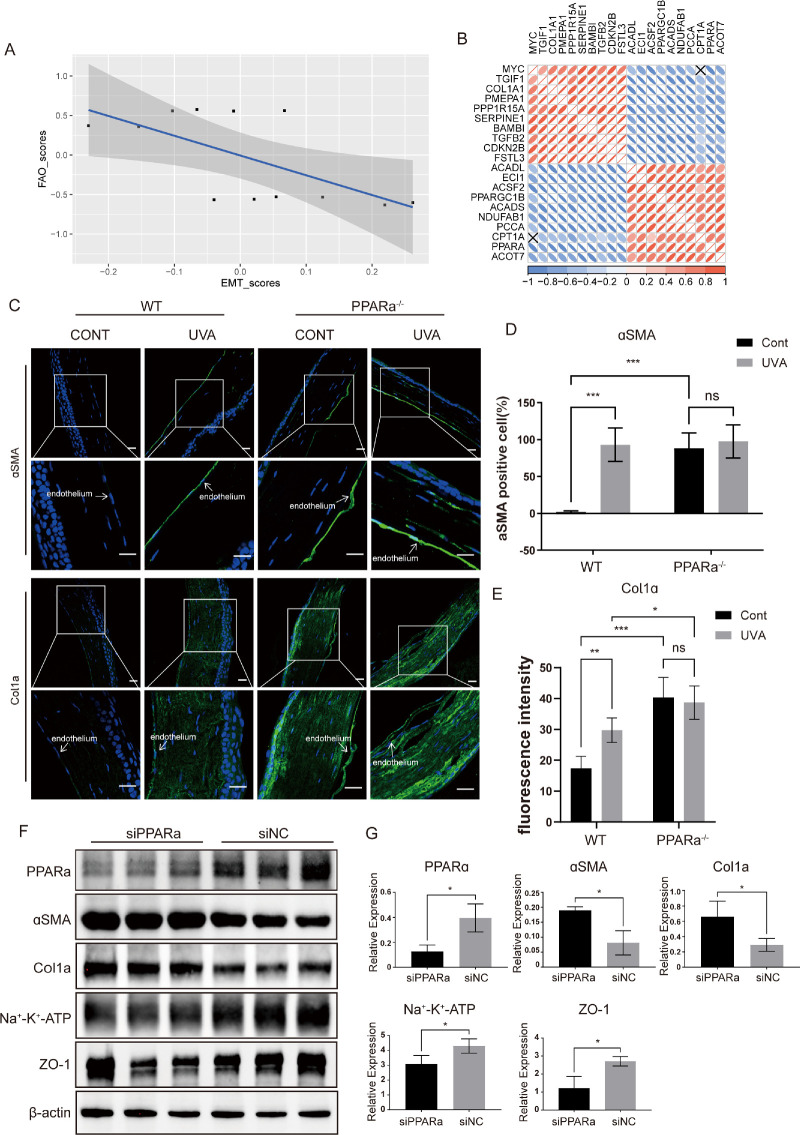
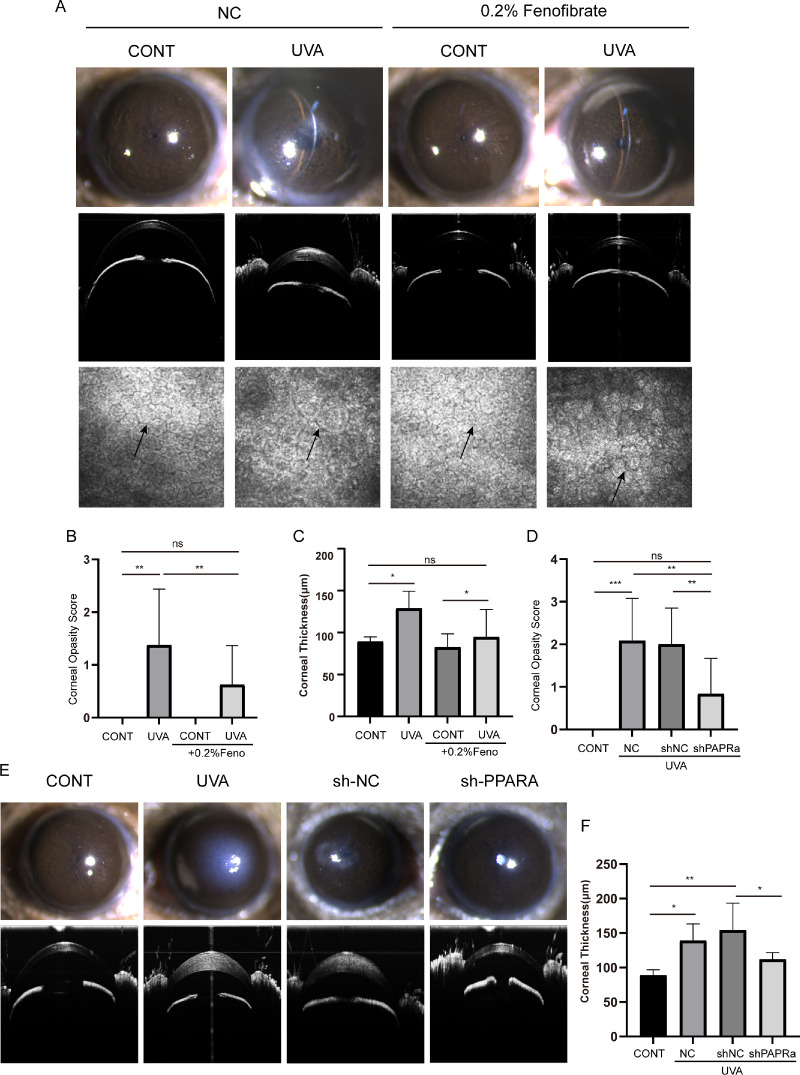
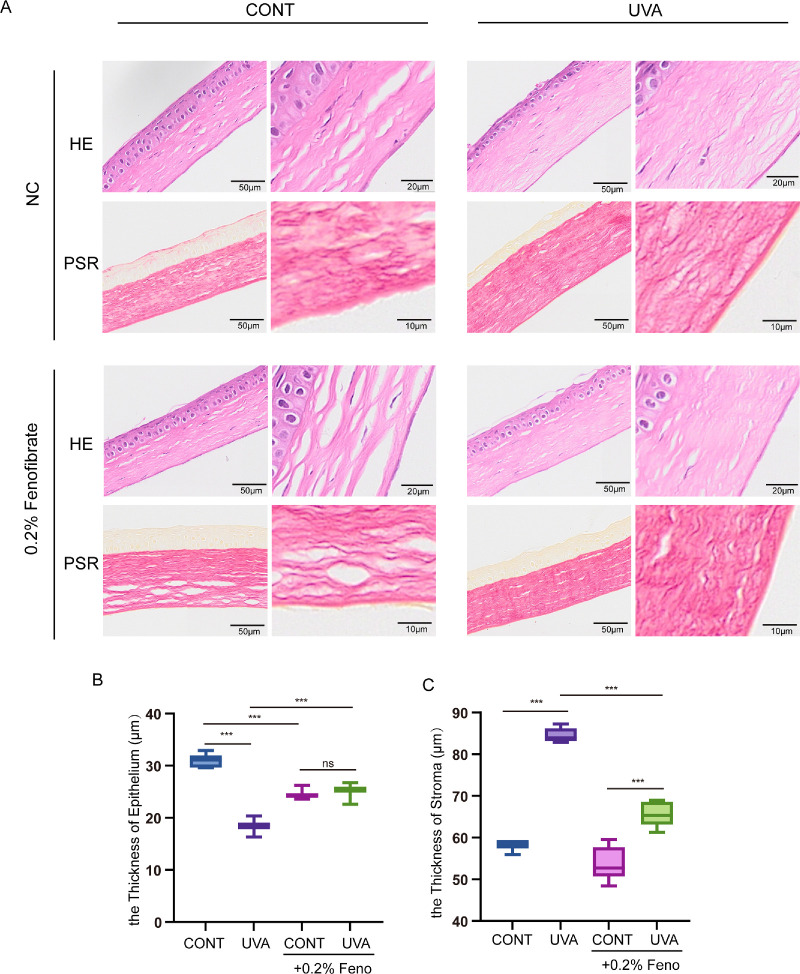
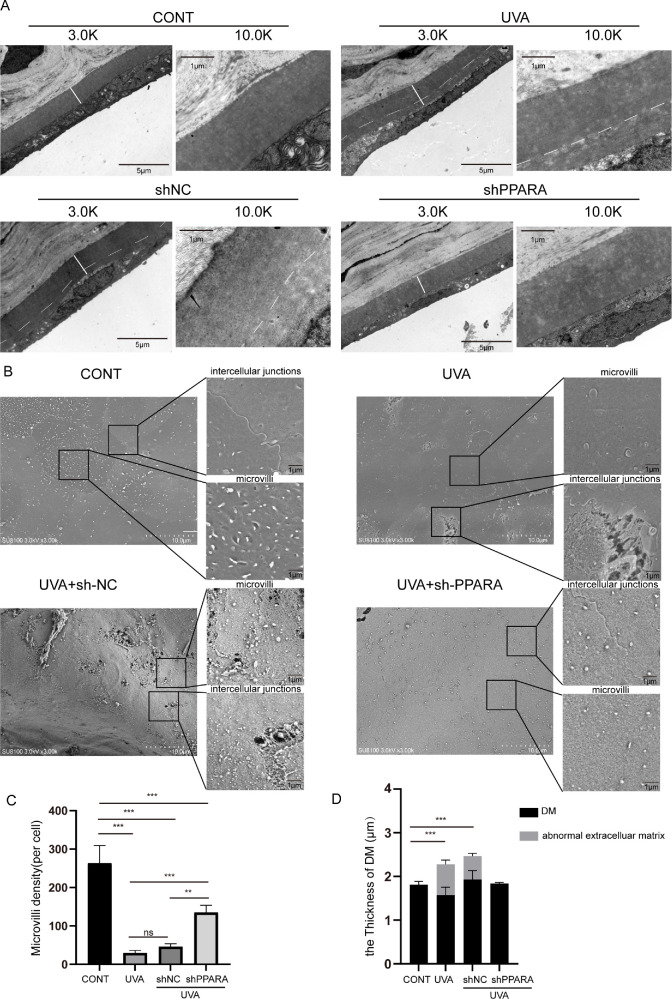
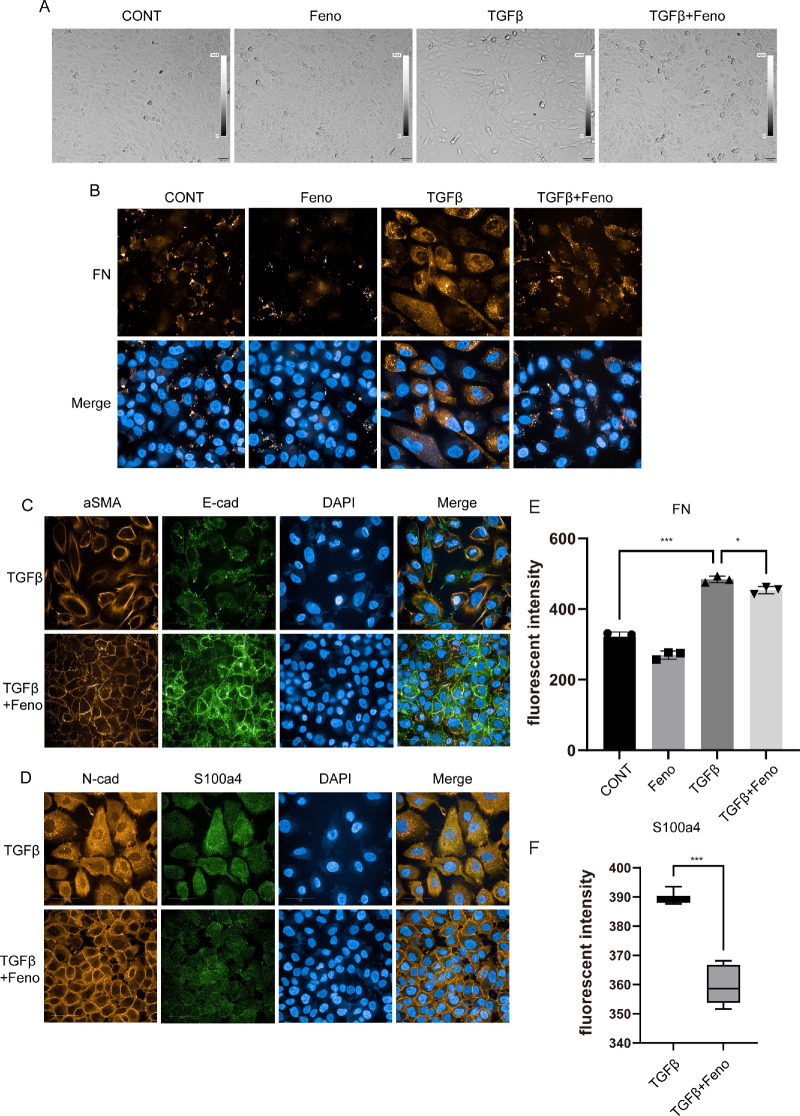
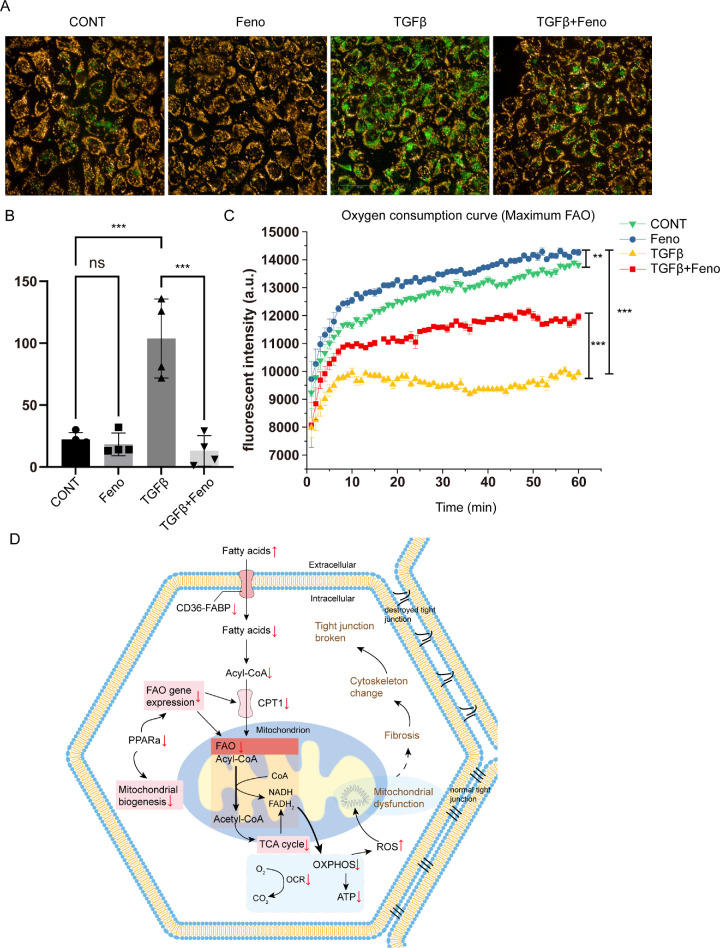
Methods and results: Mitochondria fatty acid β-oxidation (FAO) and tricarboxylic acid (TCA) cycle processes were negatively enriched in the FECD group according to gene set enrichment analysis in GSE171830. In vivo UV-A-induced late-onset FECD mouse model were established. After irradiation, aged proliferator-activated receptor alpha (PPARα-/-) mice manifested greater corneal opacity, cornea edema, and varied corneal endothelial cell morphology compared with wild-type mice. The total metabolites in cornea of aged PPARα-/- mice and wild-type mice were detected by mass spectrometry. Metabolites of the FAO pathway were decreased in corneas of PPARα-/- mice, coincident with enzymes of FAO decreased in GSE171830. The score for FAO energy metabolism was negatively related to that of the TGF-β pathway according to gene set variation analysis. The express of alpha smooth muscle actin (αSMA) and Col1a were increased in aged PPARα-/- mice and small interfering PPARα B4G12 cell lines. After irradiation, activation or overexpression of PPARα demonstrated reduced corneal endothelial damage and reversal of Descemet membrane thickening, along with downregulation of fibrosis-related genes such as αSMA and collagen type I alpha 1 (Col1a). In vitro experiments revealed that fenofibrate could reverse fibrosis and damage of cell-to-cell connections induced by TGF-β. Additionally, fenofibrate was found to alleviate mitochondrial damage in B4G12 and increase oxygen consumption rates after TGF-β treatment.

Conclusions: Overall, we suggested that the overexpression or activation of PPARα can inhibit FAO energy dysfunction of corneal endothelium and the abnormal extracellular matrix formation in Descemet's membrane, which is the primary pathology of FECD. Thus, PPARα may be a potential target for attenuating the progression of FECD.


Conflict of interest statement

Disclosure: X. Li, None; A. Liu, None; Y. Zhou, None; H. Qi, None; J. Wang, None; M. Chen, None; T. Sun, None; J. Wu, None; Y. Huang, None; L. Wang, None

Figures

Figure 1.
Figure 1.
PPARα is a key downregulated gene in the Pathogenesis of FECD. (A) In dataset GSE171830, GSEA reveals significant downregulation of mitochondrial FAO (P = 0.0029) and mitochondrial TCA cycle oxidative phosphorylation (P = 0.0056) pathways in FECD samples. (B) Volcano plot of all genes involved in mitochondrial FAO and mitochondrial TCA cycle oxidative phosphorylation processes, showing PPARα as a key downregulated gene. (C) Slit lamp photography, anterior segment OCT examination, confocal microscopy, and ZO-1 fluorescence staining of corneal endothelial morphology and density in aged PPARα−/− mice and wild-type mice exposed to 500 J/cm2 and 750 J/cm2 UV-A irradiation for 1 month. Scale bar, 20 µm. (D) Histogram of corneal opacity scores between different groups. (E) Histogram of corneal thickness between different groups. (F) Histogram of percent of Hexagonality endothelial cell between different groups. (G) Cell density between different groups. *P < 0.05, **P < 0.01, ***P < 0.001. (H) Immunofluorescence staining of PPARα in corneal, PPARα labeled with Alexa Fluor 488, cell nuclei labeled with DAPI. Scale bar, 20 µm.
Figure 2.
Figure 2.
Integrated analysis of metabolomics in corneas of PPARα−/− mice and enzymes changes in GSE171830. The color scale represents log fold change (logFC), with blue indicating downregulation, red indicating upregulation, and darker colors indicating greater |logFC| and more significant differences. The size of the circles represents the P value significance level. *P < 0.05, **P < 0.01, ***P < 0.001. The metabolites are represented using box diagram, and the metabolic enzymes are represented using scatter plots. Acyl-CoA, acetyl coenzyme A; FFA, free fatty acid; WT, wild type.
Figure 3.
Figure 3.
PPARα affects corneal endothelial fibrosis through regulating corneal endothelial FAO process. (A) Correlation analysis of GSVA activation scores for FAO and epithelial–mesenchymal transition (EMT) pathways in GSE171830 dataset (R = −0.6452; P = 0.0235). (B) Correlation analysis of key genes involved in FAO and EMT; blue indicates a negative correlation and red indicates a positive correlation. (C) Immunofluorescence staining of aged PPARα−/− mice and wild-type mice before and after exposing to 500 J/cm2 and 750 J/cm2 irradiation for 1 month, with α-SMA and COL1a labeled with Alexa Fluor 488, and cell nuclei stained with DAPI, Scale bar, 20 µm. (D) Histogram of α-SMA–positive cells (%). (E) The histogram of COL1a1 immunofluorescence intensity. n = 6,*P < 0.05, **P < 0.01, ***P < 0.001. (F) Western blot detection of α-SMA, Col1a1, Na+-K+-ATPase, and ZO-1 in PPARα-knockdown B4G12 cell line. (G) The histogram of grayscale values obtained from western blot, n = 3, *P < 0.05.
Figure 4.
Figure 4.
PPARα activation can ameliorate UV-A–induced corneal opacity, thickening, and corneal endothelial damage. (A) We conducted the following experiments: mice were fed with regular feed or feed containing 0.2% fenofibrate (a PPARα agonist). The right eye of the mice was irradiated with 750 J/cm2 UV-A, and the left eye was covered as a control. One month after UV-A irradiation, slit-lamp examination, anterior segment optical coherence tomography (OCT), and in vivo confocal microscopy tested for cornea in different groups. (B) Histogram of corneal opacity scores based on slit lamp observations. (C) Histogram of corneal thickness measured by anterior segment OCT. (D) We conducted the following experiments: the groups were divided into control, UV-A irradiation, UV-A + shNC, and UV-A + shPPARα groups. The histogram of corneal opacity scores in different groups were shown. (E) Slit-lamp examination and anterior segment OCT images in control group, UV-A exposure group, UV-A+shNC group, and UV-A+shPPARα group. (F) The histogram of corneal thickness in control group, UV-A exposure group, UV-A+shNC group, and UV-A+shPPARα group. n = 12, *P < 0.05, **P < 0.01, ***P < 0.001. cont, control; ns, not significant.
Figure 5.
Figure 5.
Activation PPARα can improve UV-A-induced corneal epithelial thinning and stromal edema. (A) Mice were divided randomly into groups fed with regular feed or 0.2% fenofibrate feed. The right eye of each mouse was exposed to 750 J/cm2 UV-A irradiation, and the left eye served as a control. After irradiation, eye globe sections were prepared and stained with hematoxylin and eosin (HE) and picrosirius red (PSR). Scale bar, 10 µm, 20 µm, or 50 µm. (B) Box diagram of the corneal epithelial thickness in the different groups. (C) Box diagram of the corneal stromal thickness in different groups (n = 6, ***P < 0.001). cont, control.
Figure 6.
Figure 6.
Overexpression PPARα can mitigate the loss of corneal endothelial microvilli, damage in intercellular junctions, and thickening of the Descemet membrane after irradiation. (A) Mice were divided into control, UV-A, shNC + UV-A, and shPPARα + UV-A groups. After irradiation, transmission electron microscopy was performed to observe the thickness of the Descemet membrane (n = 6). Scare bar, 5 µm. (B) Scanning electron microscopy was performed to observe the structure of intercellular junctions and microvilli (n = 6). Scare bar, 10 µm. (C) Histogram of the thickness of the Descemet membrane. (D) Histogram of single-cell microvilli density. DM, Descemet membrane. **P < 0.01, ***P < 0.001. cont, control.
Figure 7.
Figure 7.
Activation of PPARα improves corneal endothelial fibrosis. (A) Mice were divided randomly into groups fed with regular feed or 0.2% fenofibrate feed. The right eye of each mouse was exposed to 750 J/cm2 UV-A irradiation, and the left eye served as a control. One month after irradiation, corneal button staining was performed. PPARα was stained by Alexa Fluor 647. S100A4 was stained by Alexa Fluor 488. ZO-1 was stained by Alexa Fluor 568, and cell nuclei were stained with DAPI. Scale bar, 10 µm. (B) Box diagram of PPARα fluorescence intensity was shown. (C) The box diagram of S100A4 fluorescence intensity was shown. n = 6. *P < 0.05, **P < 0.01, ***P < 0.001. (D, E) CEC protein was extracted (10 samples per group) for Western blot analysis. n = 3. *P < 0.05, **P < 0.01, ***P < 0.001.
Figure 8.
Figure 8.
Fenofibrate suppresses TGF-β–induced fibrosis in B4G12 cells. (A) We treated B4G12 cells with 10 ng/mL of TGF-β for 24 h to induce fibrosis, and the TGF-β + Feno group received 30 µM fenofibrate simultaneous. The groups were divided into control, Feno, TGF-β, and TGF-β + Feno groups. B4G12 cells were photographed under white light. Arrowheads indicate cell morphology. (B) Fibronectin (FN) in B4G12 was stained by Alexa Fluor 568. FN is shown in red, and DAPI staining for nuclei is shown in blue. Scale bar, 50 µm. (C) α-SMA in B4G12 was stained by Alexa Fluor 568. E-cad in B4G12 was stained by Alexa Fluor 488. Scale bar, 50 µm. (D) N-cad in B4G12 was stained by Alexa Fluor 568. S100A4 in B4G12 was stained by Alexa Fluor 488. Scale bar, 50 µm. (E) Quantification of FN fluorescence intensity in B4G12. (F) Quantification of S100a4 fluorescence intensity in B4G12. n = 3. *P < 0.05, ***P < 0.001.
Figure 9.
Figure 9.
Fenofibrate protected mitochondrial integrity and mitochondrial FAO in B4G12 with TGF-β treatment. We treated B4G12 cells with 10 ng/mL of TGF-β for 24 h to induce fibrosis, and the TGF-β + Feno group received 30 µM fenofibrate simultaneous. The groups were divided into control, Feno, TGF-β, and TGF-β + Feno groups. (A) JC1 staining of B4G12 in different groups. JC-1 monomers, escaping to cytobolism from mitochondria, was shown as green, JC-1 aggregates was shown as red. (B) Histogram of JC-1 monomer positive cell calculation (per view). (C) Line graph of maximum oxygen consumption induced by FCCP. n = 3, **P < 0.01, ***P < 0.001.

Similar articles

References

    1. Gain P, Jullienne R, He Z, et al. .. Global survey of corneal transplantation and eye banking. JAMA Ophthalmol. 2016; 134(2): 167–173. - PubMed
    1. Ong Tone S, Kocaba V, Böhm M, Wylegala A, White TL, Jurkunas UV.. Fuchs endothelial corneal dystrophy: The vicious cycle of Fuchs pathogenesis. Prog Retin Eye Res. 2021; 80: 100863. - PMC - PubMed
    1. Minear MA, Li YJ, Rimmler J, et al. .. Genetic screen of African Americans with Fuchs endothelial corneal dystrophy. Mol Vis. 2013; 19: 2508–2516. - PMC - PubMed
    1. Kinoshita S. The ongoing puzzle of the biological behavior of cornea guttae. JAMA Ophthalmol. 2018; 136(8): 893–894. - PubMed
    1. Kocaba V, Katikireddy KR, Gipson I, Price MO, Price FW, Jurkunas UV.. Association of the gutta-induced microenvironment with corneal endothelial cell behavior and demise in Fuchs endothelial corneal dystrophy. JAMA Ophthalmol. 2018; 136(8): 886–892. - PMC - PubMed

LinkOut - more resources