. 2025 Apr 15;135(12):e186591.
doi: 10.1172/JCI186591. eCollection 2025 Jun 16.

Exploring [11C]CPPC as a CSF1R-targeted PET imaging marker for early Parkinson's disease severity

Affiliations

Exploring [11C]CPPC as a CSF1R-targeted PET imaging marker for early Parkinson's disease severity

Kelly A Mills et al. J Clin Invest. .

Abstract

BACKGROUNDMicroglia-mediated brain immune changes play a role in the pathogenesis of Parkinson's disease (PD), but imaging microglia in living people with PD has relied on positron emission tomography (PET) ligands that lack specificity in labeling immune cells in the nervous system. We aimed to develop imaging of colony stimulating factor 1 receptor (CSF1R) as a microglial-sensitive marker of innate immunity.METHODSIHC using a CSF1R antibody evaluated colocalization with Iba-1 in PD (n = 4) and control (n = 4) human brain samples. Autoradiography using a CSF1R tritiated ligand in human brain samples from individuals with PD (n = 5) and in a control group (n = 4) was performed to obtain Bmax. PET imaging using a CSF1R radioligand was performed in 10 controls and 12 people with PD, and VT was compared between groups and correlated with disease severity.RESULTSIHC of CSF1R in human brain samples shows colocalization with Iba-1 and is significantly increased in brain samples from individuals with PD compared with individuals in a control group. Autoradiography revealed significantly increased CSF1R ligand binding in the inferior parietal cortex of patients with PD. [11C]CPPC PET showed higher binding in people with moderate PD compared with people in a control group and ligand binding correlated with more severe motor disability and poorer verbal fluency.CONCLUSIONThis study underscores the significance of CSF1R imaging as a promising biomarker for brain immune function in Parkinson's disease, which may be associated with cognitive and motor disease severity.FUNDINGPET imaging: the Michael J. Fox Foundation and the RMS Family Foundation. Radiotracer development: NIH (R01AG066464 and P41 EB024495). Postmortem brain tissues: NIH P30 AG066507 and BIOCARD study NIH U19 AG033655.

Keywords: Inflammation; Innate immunity; Neurodegeneration; Neuroscience; Parkinson disease.


Conflict of interest statement

Conflict of interest: Under a license agreement between D&D Pharmatech and the Johns Hopkins University, the University and MGP, JMC, and AGH are entitled to royalty distributions related to the technology described in the study discussed in this publication. MGP and AGH hold equity in D&D Pharmatech. MGP has been, and AGH is, a paid consultant to the company. This arrangement has been reviewed and approved by the Johns Hopkins University in accordance with its conflict of interest policies. TMD and VLD hold shares of stock options as well as equity in D&D Pharmatech; These arrangements have been reviewed and approved by the Johns Hopkins University in accordance with its conflict of interest policies.

Figures

Figure 1
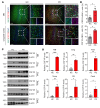
Figure 1. Increased levels of CSF1R in brains of human patients with PD (N = 4).
(A) Representative confocal images with DAPI (blue), IBA1 (green), and CSF1R (red) in the midbrain and cingulate cortex of age-matched individuals who were in the healthy control and PD groups. White dashed lines indicate the region for high-magnification images. Scale bars: 200 μm (low-magnification images); 50 μm (high-magnification images). (B) CSF1R+ cells with IBA1+ cells are quantified (mean ± SEM; dots=individual data points); P values from independent, 2-tailed Student’s t tests. *P < 0.05, PD versus healthy control. (C) Representative immunoblots with CSF1R and β-actin antibodies in the midbrain (MB), cingulate cortex (Cing), posterior cingulate cortex (Post), temporal cortex (Temp), cerebellar cortex (CB) and caudate (Caud) of age-matched individuals who were in the healthy control and PD groups. (D) Relative CSF1R levels normalized to β-actin was quantified (n = 4). Individual data are shown as dots, bars are the mean ± SEM. P values were determined by unpaired 2-tailed Student’s t tests. *P < 0.05, **P < 0.005, ***P < 0.0005, PD versus healthy control.
Figure 2
Figure 2. In vitro CSF1R autoradiography with [3H]JHU11761 in human inferior parietal cortex with and without Parkinson’s disease.
Labels show diagnosis of Parkinson’s disease (PD) or control (C) with donor age and sex. Tritium scales standards on the left depict densities beginning at 5.89 nmol/g (1; yellow) and serially decrease until (7; blue), 0.09 nmol/g. Gray matter Bmax is indicated to the left of each case.
Figure 3
Figure 3. Bmax of 3H-JHU11761 from human frozen sections in Healthy Controls (N = 6) or people with Parkinson’s disease (N = 6).
Samples from (A) inferior parietal cortex gray matter (IPCGM) and white matter (IPCWM), and (B) white matter and (C) gray matter Bmax in the caudate nucleus (CN), midbrain (MB), and basal ganglia (BG). Boxes indicate the interquartile (25th–75th) range, whiskers show 1.5 times interquartile range, the line in the box indicates the median and dots indicate outliers greater than or less than 1.5 times the interquartile range. IPCGM and IPCWM are shown separately due to difference in y-axis scale. Student’s independent t test was used for comparing Bmax in HC vs PD, *P < 0.05.
Figure 4
Figure 4. Regional total volume of distribution (VT) of [11C]CPPC, a CSF1R PET radioligand, in people with mild or moderate PD, defined by motor disability, and controls of a similar age.
Boxes indicate the interquartile (25th–75th) range, whiskers show 1.5 times interquartile range, the line in the box indicates the median and dots indicate outliers greater than or less than 1.5 times the interquartile range. *P < 0.05 and **P < 0.004 for ANOVA and post hoc test between moderate PD (N = 4) and mild PD (N = 10) and or moderate PD vs healthy controls (N = 10). ACC, anterior cingulate cortex; CBx, cerebellar corte;, FC, frontal cortex; Hp, hippocampus; OC, occipital cortex; PC, parietal cortex; PCC, posterior cingulate cortex; Str, striatum; TC, temporal cortex; Th, thalamus.
Figure 5
Figure 5. Correlation between regional [11C]CPPC VT and motor disability in Parkinson’s disease.
Scatter plots and linear relationship between [11C]CPPC VT and ADL disability from motor symptoms in people with PD (n = 12), measured by MDS-UPDRS Part II in regions of interest that showed a statistically significant relationship (P < 0.005) using Pearson correlation, including (A) Brainstem and (B) Temporal cortex.

Update of

Similar articles

Cited by

References

    1. Liddelow SA, et al. Neurotoxic reactive astrocytes are induced by activated microglia. Nature. 2017;541(7638):481–487. doi: 10.1038/nature21029. - DOI - PMC - PubMed
    1. Mamais A, et al. Convergence of signalling pathways in innate immune responses and genetic forms of Parkinson’s disease. Neurobiol Dis. 2022;169:105721. doi: 10.1016/j.nbd.2022.105721. - DOI - PubMed
    1. Krasemann S, et al. The TREM2-APOE pathway drives the transcriptional phenotype of dysfunctional microglia in neurodegenerative diseases. Immunity. 2017;47(3):566–581. doi: 10.1016/j.immuni.2017.08.008. - DOI - PMC - PubMed
    1. Panicker N, et al. Neuronal NLRP3 is a parkin substrate that drives neurodegeneration in Parkinson’s disease. Neuron. 2022;110(15):2422–2437. doi: 10.1016/j.neuron.2022.05.009. - DOI - PMC - PubMed
    1. Braak H, et al. Staging of brain pathology related to sporadic Parkinson’s disease. Neurobiol Aging. 2003;24(2):197–211. doi: 10.1016/S0197-4580(02)00065-9. - DOI - PubMed

MeSH terms

Substances