. 2025 Apr 15;10(10):e185618.
doi: 10.1172/jci.insight.185618. eCollection 2025 May 22.

Characterization of a pathogenic nonmigratory fibroblast population in systemic sclerosis skin

Affiliations

Characterization of a pathogenic nonmigratory fibroblast population in systemic sclerosis skin

Kristina En Clark et al. JCI Insight. .

Abstract

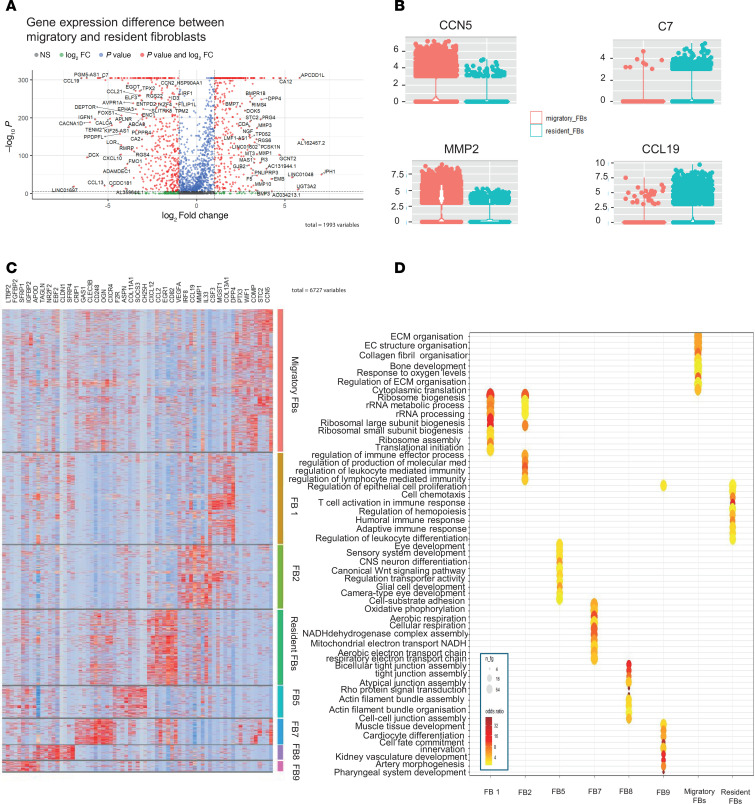
Fibroblasts are central to pathogenesis of systemic sclerosis (SSc). However, studies of conventional explant fibroblast cultures incompletely reflect disease biology and treatment response. We isolated a second nonmigratory "resident" population of fibroblasts from skin biopsies after outgrowth of explant "migratory" cells. These nonmotile resident fibroblasts were compared with migratory cells from the same biopsy, using functional studies, bulk and single-cell RNA-seq, and localized in situ by multichannel immunofluorescence. Migratory and resident fibroblast populations in SSc showed distinct profibrotic characteristics and gene expression for pathogenic pathways differing by stage and autoantibody subgroup. TGF-β signaling was highly active in migratory fibroblasts in early-stage diffuse cutaneous SSc (dcSSc). Conversely, resident fibroblasts had less upregulated TGF-β signaling, especially in late-stage dcSSc. Increased chemokine expression was a hallmark of resident fibroblasts at all stages. In vitro studies confirmed differential response to TGF-β1 and CCL2 between migratory and resident cells. We suggest that migratory fibroblasts are especially important in early skin disease, whereas nonmigratory fibroblasts may have a regulatory role and contribute more to fibrosis in later-stage disease. Thus, we have identified a pathogenic fibroblast population in SSc, not isolated by conventional explant culture, that could play an important role in fibrosis and be targeted therapeutically.

Keywords: Autoimmune diseases; Autoimmunity; Fibrosis; Immunology; Inflammation.


Conflict of interest statement

Conflict of interest: CPD reports consulting fees from Janssen, GlaxoSmithKline, Boehringer Ingelheim, Roche, CSL Behring, Corbus, Acceleron, Horizon, Arxx Therapeutics, Lilly, Novartis, Certa Therapeutics, and Zurabio, and research grants from AbbVie, GSK, Horizon, Arxx Therapeutics, and Servier. CDB has received research support or consultancy fees from J&J, UCB Pharma, AbbVie, Roche, and GSK. He has shares in Mestag Therapeutics.

Figures

Figure 1
Figure 1. Isolation and functional characterization of migratory and resident skin fibroblasts.
(A) Schematic of the study design. Biopsies were taken from individuals for scRNA-seq and highly multiplexed immunofluorescence. Separate biopsies were also taken for cell culture, and 2 distinct fibroblast populations were isolated. Analysis of bulk RNA-seq of the 2 fibroblast populations was then integrated with the scRNA-seq atlas. (BD) Western blots showing each fibroblast subgroup production of (B) collagen type 1, (C) αSMA, and (D) CCN2, which were all overexpressed in SSc dermal fibroblasts compared with HC; however, differences were seen in SSc fibroblasts for αSMA production. Each dot represents a patient sample. Protein expression was normalized to GAPDH. (E) Scratch assay showing percentage of remaining gap size and (F) contraction assay showing weight of the lattice plug. Representative images of scratch assay performed over an incubation period of 48 hours (E, lower panel) and those of gel contraction assay performed over an incubation period of 24 hours (F, lower panel) are shown. HC, healthy control; SSc, systemic sclerosis; -E, early explant migratory fibroblasts; -R, resident fibroblasts; α-SMA, α-smooth muscle actin; CCN2, connective tissue growth factor; COL1, collagen type 1. Statistical significance was determined using a 2-tailed, unpaired Student’s t test.
Figure 2
Figure 2. Bulk gene expression analysis for resident and migratory fibroblasts.
(A) PCA plot of bulk RNA-seq gene expression for each fibroblast cluster isolated, demonstrating notable differences between the SSc migratory and resident fibroblasts. (B) Volcano plot of significantly overexpressed (fold change > 1.5 and P value < 0.05) genes between SSc migratory (positive) and SSc resident fibroblasts (negative). (C) Bar chart showing αSMA levels (mean ± SEM of triplicate cultures) by qPCR of independent fibroblast strains, from both HC and SSc fibroblast subpopulations. HC, healthy control; SSc, systemic sclerosis; -E, early explant migratory fibroblasts; -R, resident fibroblasts. Statistical significance was determined using a 2-tailed, unpaired Student’s t test.
Figure 3
Figure 3. Identifying the resident and migratory fibroblasts within the UMAP fibroblast atlas.
(A) Original fibroblast UMAP atlas featuring 10 fibroblast clusters. (B) Violin plots showing expression of genes within the scRNA-seq clusters; the gene list was obtained from those overexpressed in resident fibroblasts on bulk RNA-seq. Clusters 3 and 6 seem to represent resident fibroblasts. (C) Violin plots showing expression of migratory fibroblast genes, with the gene list from those overexpressed by migratory fibroblasts on bulk RNA-seq. Clusters 0 and 4 show similar expression to migratory fibroblasts. (D) Expression density plots of STC2 and COMP (from migratory fibroblasts), and CCL2 and EGR1 (lower panels, from resident fibroblasts). (E) Renaming of the fibroblast clusters as resident fibroblasts (blue), migratory fibroblasts (red), and other fibroblasts (green).
Figure 4
Figure 4. Understanding the migratory and resident fibroblasts through the scRNA-seq data.
(A) Volcano plot comparing migratory and resident fibroblast clusters. (B) Gene expression differences between migratory and resident fibroblasts for certain key genes — CCN5 and MMP2 increased in migratory fibroblasts, and CCL19 and C7 increased in resident fibroblasts. (C) Heatmap showing top 10 overexpressed genes by fibroblast cluster. (D) Top 10 overexpressed GO biological processes by fibroblast cluster. Migratory fibroblasts were dominated by pathways involving ECM and collagen organization, whereas resident fibroblasts overexpressed pathways associated with immune response and recruitment. FB, fibroblast. Statistical significance was determined using a 2-tailed, unpaired Student’s t test.
Figure 5
Figure 5. Identifying migratory and resident fibroblasts in the whole-skin scRNA-seq atlas.
(A) Whole-skin scRNA-seq atlas, as published by Clark et al. (2). (B) Key markers identifying migratory and resident fibroblasts, and expression by cell type. (C) UMAP expression plots showcasing markers of migratory fibroblasts (STC2 and CCN5) and resident fibroblasts (CCL2 and EGR1).
Figure 6
Figure 6. Distinct localization of resident and migratory fibroblast populations in skin from early-stage dcSSc.
Representative immunostaining shows location of migratory fibroblasts (A, red arrow) and resident fibroblasts (B, short blue arrow) in distinct locations in skin biopsy section from early diffuse cutaneous SSc. Fibroblast phenotype was confirmed by COLIV expression (yellow) colocalization with MMP2 for migratory and CD90 for resident fibroblasts. Sections in the lower panel (C) include resident and migratory cells in the same section. DAPI was used to stain nuclei for confirmation of cellular structures. Original magnification, ×10 (insets) and ×20 (all others).
Figure 7
Figure 7. Cellular interaction and differential cytokine response for migratory and resident fibroblasts.
Top 15 differentially expressed genes by stage in (A) migratory fibroblasts and (B) resident fibroblasts. (C) CellChat analysis revealed the TGF-β pathway as a cell cluster influencer in early- and late-stage dcSSc. (D) The CCL pathway is a cell cluster influencer in early- and late-stage dcSSc. In C and D, migratory fibroblasts are marked with an *, and resident fibroblasts with a #. (E) Western blot analysis for subconfluent fibroblast monolayer cultures treated with recombinant TGF-β1 and CCL2 (MCP-1) in replicate cultures of fibroblasts derived from HC (n = 3) or early dcSSc (n = 3) skin. Summary quantitation for each gel in replicate samples with individual data points shown. Overall, TGF-β1 has a stimulatory effect on all proteins in migratory and resident fibroblasts, which is more obvious in HC strains. CCL2 generally has a greater relative effect on resident fibroblasts, promoting profibrotic protein expression compared with the low basal expression of αSMA by HC strains in this experiment. Together, these functional data are consistent with constitutive activation of both populations in SSc and low basal activation in HCs, with an enhanced response in migratory and resident cells to TGF-β1 and CCL2, respectively.
Figure 8
Figure 8. Differing frequency and pathway activation in fibroblasts by SSc stage and autoantibody subset.
(A) Stacked bar chart showing proportion of each cell type by stage and autoantibody. Migratory fibroblasts represented in red, and resident fibroblasts in dark blue. (B) GO biological process analysis of migratory fibroblasts by autoantibody and stage subsets. Red = highly significantly expressed pathway (adjusted P value < 0.01), blue = adjusted P value > 0.13. (C) GO biological processes pathways overrepresented in resident fibroblasts by autoantibody and stage. Red = highly significantly expressed pathway (adjusted P value < 0.01), blue = adjusted P value > 0.13. ATA late stage did not have any significantly overexpressed pathways, and therefore was not included in the dot plot. Statistical significance was determined using a 2-tailed, unpaired Student’s t test.

Similar articles

References

    1. Shand L, et al. Relationship between change in skin score and disease outcome in diffuse cutaneous systemic sclerosis: application of a latent linear trajectory model. Arthritis Rheum. 2007;56(7):2422–2431. doi: 10.1002/art.22721. - DOI - PubMed
    1. Clark KEN, et al. Single-cell analysis reveals key differences between early-stage and late-stage systemic sclerosis skin across autoantibody subgroups. Ann Rheum Dis. 2023;82(12):1568–1579. doi: 10.1136/ard-2023-224184. - DOI - PMC - PubMed
    1. Clark KEN, et al. Molecular basis for clinical diversity between autoantibody subsets in diffuse cutaneous systemic sclerosis. Ann Rheum Dis. 2021;80(12):1584–1593. doi: 10.1136/annrheumdis-2021-220402. - DOI - PubMed
    1. Spiera R, et al. Efficacy and safety of lenabasum, a cannabinoid type 2 receptor agonist, in a phase 3 randomized trial in diffuse cutaneous systemic sclerosis. Arthritis Rheumatol. 2023;75(9):1608–1618. doi: 10.1002/art.42510. - DOI - PubMed
    1. Khanna D, et al. Tofacitinib blocks IFN-regulated biomarker genes in skin fibroblasts and keratinocytes in a systemic sclerosis trial. JCI Insight. 2022;7(17):e159566. doi: 10.1172/jci.insight.159566. - DOI - PMC - PubMed

MeSH terms

Substances