. 2025 Apr 15;135(12):e184636.
doi: 10.1172/JCI184636. eCollection 2025 Jun 16.

Transcriptome-guided GLP-1 receptor therapy rescues metabolic and behavioral disruptions in a Bardet-Biedl syndrome mouse model

Affiliations

Transcriptome-guided GLP-1 receptor therapy rescues metabolic and behavioral disruptions in a Bardet-Biedl syndrome mouse model

Arashdeep Singh et al. J Clin Invest. .

Abstract

Bardet-Biedl syndrome (BBS), a ciliopathy characterized by obesity, hyperphagia, and learning deficits, arises from mutations in Bbs genes. Exacerbated symptoms occur with mutations in genes encoding the BBSome, a complex regulating primary cilia function. We investigated the mechanisms underlying BBS-induced obesity using a Bbs5-knockout (Bbs5-/-) mouse model. Bbs5-/- mice were characterized by hyperphagia, learning deficits, glucose/insulin intolerance, and disrupted metabolic hormones, phenocopying human BBS. White adipose tissue in these mice had a unique immunophenotype, with increased proinflammatory macrophages and dysfunctional Tregs, suggesting a mechanism for adiposity distinct from those of typical obesity models. Additionally, Bbs5-/- mice exhibited pancreatic islet hyperplasia but failed to normalize blood glucose, suggesting defective insulin action. Hypothalamic transcriptomics revealed dysregulation of endocrine signaling pathways, with functional analyses confirming defects in insulin, leptin, and cholecystokinin (CCK) signaling, while glucagon-like peptide-1 receptor (GLP-1R) responsiveness was preserved. Notably, treatment with a GLP-1RA effectively alleviated hyperphagia and body weight gain, improved glucose tolerance, and regulated circulating metabolic hormones in Bbs5-/- mice. This study suggests that Bbs5-/- mice represent a valuable translational model of BBS for understanding pathogenesis and developing better treatments. Our findings highlight the therapeutic potential of GLP-1RAs for managing BBS-associated metabolic dysregulation, indicating that further investigation for clinical application is warranted.

Keywords: Endocrinology; Macrophages; Metabolism; Monogenic diseases; Obesity.


Conflict of interest statement

Conflict of interest: The authors have declared that no conflict of interest exists.

Figures

Figure 1
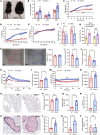
Figure 1. Adult Bbs5-null mice are morbidly obese, hyperphagic, glucose intolerant, and have behavioral and learning impairments.
(A) Representative image of 12-week-old ad libitum chow-fed male WT C57BL/6J and Bbs5–/– mice. (B) Average cumulative daily ad libitum food intake during 12-hour dark and light and 24-hour periods in 10- to 18-week-old mice (n = 9 per group). (CF) Weekly body weight (C), fat mass (D), and lean mass (E) during development in 5- to 20-week-old male mice (n = 5–12 per group). (F) Nest-building score after 12 and 24 hours upon provision of cotton-pressed nestlets for 12- to 18-week-old mice (n = 7–12 per group). (G) Percent exploration time with familiar or novel objects in the NOR paradigm (n = 5–8 per group). (H) Representative traces of WT and Bbs5–/– mice during 5-minute open-field test. (HJ) Distance traveled (H), number of entries (I), and time duration in the center (J) in 14- to 18-week-old mice (n = 6 per group). (K and L) Intraperitoneal glucose tolerance (K) and area under the curve (L) in 11- to 18-week-old mice (n = 6–8 per group). (M and N) Insulin tolerance (M) and area under the curve (N) in 11- to 18-week-old mice (n = 6–8 per group). (OV) Representative images of islet immunohistochemistry for insulin, glucagon, and somatostatin staining from pancreas sections (O; scale bars: 3 mm); quantitative analyses of total pancreas area (P); number of islets (Q); percent islet area (R); higher-magnification images showing normal distribution of central β cells (pink), with peripherally located glucagon (blue) and somatostatin (brown) cells (S; scale bars: 200 μm); average islet size (T); number of insulin cells per islet (U); and percent insulin cells relative to proliferating cells (V) of 16- to 18-week-old mice (n = 5–6 per group). Data in BG, K, and M were analyzed using repeated-measure 2-way ANOVA with Benjamini, Krieger, and Yekutieli post hoc test (FDR = 0.05) to compare individual time points. Data in HJ, L, N, PR, and TV were analyzed using Student’s 2-sided, 2-tailed t test. Data are mean ± SEM from chow-fed WT and Bbs5–/– male mice; *P < 0.05; **P < 0.01; ***P < 0.001.
Figure 2
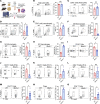
Figure 2. Adult Bbs5-null mice have dysregulated plasma levels of circulating metabolic hormones.
(AL) Plasma concentrations of insulin (A), GLP-1 (active) (B), leptin (C), PYY (D), C-peptide 2 (E), GIP (total) (F), amylin (active) (G), glucagon (H), PP (I), ghrelin (J), resistin (K), and secretin (L) in 15- to 22-week-old ad libitum chow-fed male and female WT C57BL/6J and Bbs5–/– mice (n = 9 per strain). Data in AL were analyzed using Student’s 2-sided, 2-tailed t test. Data are mean ± SEM from WT and Bbs5–/– mice; *P < 0.05; **P < 0.01; ***P < 0.001; ****P < 0.0001.
Figure 3
Figure 3. Adult Bbs5-null mice have a proinflammatory white adipose immunophenotype.
(A) Schematic workflow diagram of the isolation of immune cells in the stromal vascular fraction (SVF) of eWAT from male WT and Bbs5–/– mice by flow cytometry. (BO) Flow cytometry analysis of CD45+ cells (B), neutrophils (C), Ly6Ghi monocytes (D), total macrophages (E), CD206+CD301b+ M2 macrophages (F), Arg+ M2 macrophages (G), iNOS+ M1 macrophages (H), CD45+CD4+ T cells (I), Gata3 Th2 cells (J), Rorγt Th17 cells (K), T-bet Th1 cells (L), Foxp3+ Tregs (M), IL-17+ Tregs (N), and Rorγt+Foxp3+ Tregs (O) in eWAT of 18- to 22-week-old male WT and Bbs5–/– mice (n = 4–6 per group). Data are representative of 2 independent experiments. Data in BO were analyzed using Student’s 2-sided, 2-tailed t test. Data are mean ± SEM from male WT and Bbs5–/– mice; *P < 0.05; **P < 0.01; ***P < 0.001; ****P < 0.0001.
Figure 4
Figure 4. Hypothalamic RNA transcriptomics predicts leptin and CCK resistance but retention of GLP-1 response in male Bbs5-null mice.
(A) Volcano plot of differential expression changes, plotting the log fold change (FC) in receptors in the hypothalamus in 12-week-old male Bbs5–/– relative to WT mice (n = 2–3 per group). Red dots represent significant differences; black, nonsignificant. (B) Schematic experimental design to determine anorexigenic effects of leptin, CCK-8, and GLP-1RA exendin-4 in overnight-fasted male WT and Bbs5–/– mice. (C and D) The effect of i.p. leptin (red, 2 mg/kg body weight) or vehicle (black) injection on cumulative ad libitum food intake in 12- to 18-week-old male WT (C) and Bbs5–/– (D) mice over 24 hours (n = 9 per group). (E and F) Body weight gain in WT (E) and Bbs5–/– (F) mice at 24 and 36 hours after leptin injections. (G and H) Effect of i.p. CCK-8 (orange, 2 μg/kg body weight) or vehicle (black) injection on cumulative ad libitum food intake in 12- to 18-week-old male WT (G) and Bbs5–/– (H) mice over 24 hours (n = 7–9 per group). (I and J) Food intake suppression after 2 (I) or 11 hours (J) in 12- to 18-week-old male WT and Bbs5–/– mice following CCK-8 (2 or 4 μg/kg body weight) relative to saline injection (n = 7–9 per group). (K and L) Effect of i.p. exendin-4 (purple, 1 μg/kg body weight) or vehicle (black) injection on cumulative ad libitum food intake in 12- to 18-week-old male WT (K) and Bbs5–/– (L) mice over 24 hours (n = 8 per group). (M and N) Food intake suppression after 2 (M) or 11 hours (N) in 12- to 18-week-old male WT and Bbs5–/– mice following exendin-4 (0.1 or 1 or 2 μg/kg body weight) relative to saline injection (n = 8 per group). Data in CN were analyzed using repeated-measure 2-way ANOVA with Benjamini, Krieger, and Yekutieli post hoc test (FDR = 0.05) to compare individual time points. Data are mean ± SEM from chow-fed WT (vehicle or drug treated) and Bbs5–/– (vehicle or drug treated) male mice; nd, no discovery; *P < 0.05; **P < 0.01; ***P < 0.001.
Figure 5
Figure 5. GLP-1RA semaglutide promotes hypophagia-induced weight loss and improves nesting behavior and glucose tolerance in adult Bbs5-null mice.
(A) Schematic diagram of study timeline: obese ad libitum chow-fed Bbs5–/– mice received daily subcutaneous injections of vehicle (blue) for 14 days, followed by semaglutide (pink, 0.15 mg/body weight) for 14 days; and were observed for changes in feeding, body composition, nest-building behavior, and glucose tolerance. The data in BK are from 19- to 30-week-old Bbs5–/– mice (n = 18; 6 males and 12 females). (BD) Changes in ad libitum chow intake daily over 24 hours (B); average cumulative intake during 12-hour dark and 12-hour light and 24-hour periods (C); and average cumulative daily food intake during 14 days of vehicle (VEH) or semaglutide (SEMA) therapy (D). (EH) Average daily changes in body weight (E); average percent weight loss (F); and weekly changes in fat mass (G) and lean mass (H) after semaglutide therapy. (I) Nesting score after 12 and 24 hours upon provision of pressed cotton nestlet before and after semaglutide therapy. (J and K) Intraperitoneal glucose tolerance (J) and area under the curve (K) before and after semaglutide therapy. Data in BK were analyzed using Student’s 2-sided, 2-tailed t test or repeated-measure 2-way ANOVA with Benjamini, Krieger, and Yekutieli post hoc test (FDR = 0.05) to compare individual time points. Data are mean ± SEM from vehicle- or drug-treated mice; *P < 0.05; **P < 0.01.
Figure 6
Figure 6. Semaglutide treatment improves dysregulated plasma levels of circulating metabolic hormones in adult Bbs5-null mice.
(AL) Plasma concentrations of GLP-1 (active) (A), insulin (B), leptin (C), PYY (D), C-peptide 2 (E), GIP (total) (F), amylin (G), glucagon (H), PP (I), ghrelin (J), resistin (K), and secretin (L) in 22- to 28-week-old female ad libitum chow-fed WT C57BL/6J and Bbs5–/– mice (n = 5 per group) before and after semaglutide therapy. Data in AL were analyzed using 2-way ANOVA with Benjamini, Krieger, and Yekutieli post hoc test (FDR = 0.05) to compare individual time points. Data are mean ± SEM from WT and Bbs5–/– mice; means with no letters in common represent significantly different values (P < 0.05).

Comment in

  • Should GLP-1 receptor agonist therapy be used to treat obesity in Bardet-Biedl syndrome? doi: 10.1172/JCI191822

References

    1. Nachury MV, Mick DU. Establishing and regulating the composition of cilia for signal transduction. Nat Rev Mol Cell Biol. 2019;20(7):389–405. doi: 10.1038/s41580-019-0116-4. - DOI - PMC - PubMed
    1. Tomlinson JW. Bardet-Biedl syndrome: a focus on genetics, mechanisms and metabolic dysfunction. Diabetes Obes Metab. 2024;26 Suppl 2:13–24. doi: 10.1111/dom.15480. - DOI - PubMed
    1. Khan SA, et al. Genetics of human Bardet-Biedl syndrome, an updates. Clin Genet. 2016;90(1):3–15. doi: 10.1111/cge.12737. - DOI - PubMed
    1. Li JB, et al. Comparative genomics identifies a flagellar and basal body proteome that includes the BBS5 human disease gene. Cell. 2004;117(4):541–552. doi: 10.1016/S0092-8674(04)00450-7. - DOI - PubMed
    1. Nachury MV, et al. A core complex of BBS proteins cooperates with the GTPase Rab8 to promote ciliary membrane biogenesis. Cell. 2007;129(6):1201–1213. doi: 10.1016/j.cell.2007.03.053. - DOI - PubMed