. 2025 Apr 15;23(4):e3003080.
doi: 10.1371/journal.pbio.3003080. eCollection 2025 Apr.

Staphylococcal toxin PVL ruptures model membranes under acidic conditions through interactions with cardiolipin and phosphatidic acid

Affiliations

Staphylococcal toxin PVL ruptures model membranes under acidic conditions through interactions with cardiolipin and phosphatidic acid

Seong H Chow et al. PLoS Biol. .

Abstract

Panton-Valentine leukocidin (PVL) is a pore-forming toxin secreted by Staphylococcus aureus strains that cause severe infections. Bicomponent PVL kills phagocytes depending on cell surface receptors, such as complement 5a receptor 1 (C5aR1). How the PVL-receptor interaction enables assembly of the leukocidin complex, targeting of membranes, and insertion of a pore channel remains incompletely understood. Here, we demonstrate that PVL binds the anionic phospholipids, phosphatidic acid, and cardiolipin, under acidic conditions and targets lipid bilayers that mimic lysosomal and mitochondrial membranes, but not the plasma membrane. The PVL-lipid interaction was sufficient to enable leukocidin complex formation as determined by neutron reflectometry and the rupture of model membranes, independent of protein receptors. In phagocytes, PVL and its C5aR1 receptor were internalized depending on sphingomyelin and cholesterol, which were dispensable for the interaction of the toxin with the plasma membrane. Internalized PVL compromised the integrity of lysosomes and mitochondria before plasma membrane rupture. Preventing the acidification of organelles or the genetic loss of PVL impaired the escape of intracellular S. aureus from macrophages. Together, the findings advance our understanding of how an S. aureus toxin kills host cells and provide key insights into how leukocidins target membranes.


Conflict of interest statement

The authors have declared that no competing interests exist.

Figures

Fig 1
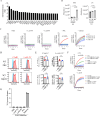
Fig 1. PVL forms a protein complex on supported lipid bilayers containing anionic phospholipids at acidic pH.
(A) Protein-lipid overlay assay using purified LukS-PV or PVL (10 µg/ml; equal molar concentration of LukS-PV and LukF-PV) and probed with anti-LukS-PV antibodies. Data representative of two independent experiments. (B–C) Quartz-crystal microbalance with dissipative monitoring (QCM-D) assays using lipid bilayer of (B) POPC/POPA (w/w 2:1) or (C) POPC/TOCL (w/w 2:1), added at indicated 1↓, exchanged buffer to neutral or acid pH at 2↓ and exposed to PVL (100 µg/ml) at 3↓. Blue: frequency; red: dissipation. Data representative of two independent experiments. (D) Sulforhodamine B encapsulated liposomes of POPC, POPC/TOCL (w/w 2:1), or POPC/POPA (w/w 3:1) were treated with purified PVL (1 µg/ml) or its subunits (LukS-PV, LukF-PV) at neutral or acidic pH and fluorescence was determined after 30 min, compared to control Triton X-100 treatment. Mean ± SEM from three independent experiments, P values (one-way ANOVA followed by Dunnett’s multiple Comparison test) are shown. (E–F) Neutron reflectometry (NR) measurements of purified PVL (100 µg/ml) exposed to (E) POPC/TOCL (w/w 2:1) and (F) POPC/POPA (w/w 2:1) membrane in pH 5.0 buffer. Black curve: measurement in D2O buffer; Blue curve: measurement in contrast matched Si buffer (CmSi); Red curve: measurement in H2O buffer. (G–H) Scattering length density profiles with cartoons for PVL with (G) POPC/TOCL and (H) POPC/POPA membranes. Black line: measurement in D2O buffer; Blue line: measurement in contrast matched Si buffer (CmSi); Red line: measurement in H2O buffer. The data underlying this Figure can be found in S1 Data.
Fig 2
Fig 2. PVL toxicity depends on host sphingomyelin and cholesterol.
(A) 25 most enriched genes identified in a CRISPR screen in human macrophages treated with PVL. (B) Relative abundance levels of total sphingomyelin (SM) and phosphatidylcholine (PC) in wild type and SGMS1 KO #1 and #2 THP-1 macrophages. Mean ± SEM from five independent experiments, P values (one-way ANOVA followed by Dunnett’s multiple Comparison test) are shown. (C) Cell death (Draq7-positive) of wild type and two independent SGMS1 KO THP-1 macrophages treated with PVL (62.5 ng/ml) or LukAB (15.6 ng/ml) overtime. Mean ± SEM from three independent experiments, P values (one-way ANOVA) are shown. (D) Flow cytometry of cell-surface levels of C5aR1 and LukS-PV in WT THP-1 macrophages treated with methyl-beta-cyclodextrin (MβCD) or control PBS. Blue line indicates isotype control, red line antigen-specific antibodies. Data representative of three independent experiments. (E) Mean fluorescence intensity (MFI) of C5aR1 and LukS-PV in PBS- or MβCD-treated macrophages. Mean ± SEM from three independent experiments. ns = not significant; unpaired t test. (F) Cell death (Draq7-positive) of human THP-1 macrophages treated with PVL (62.5 ng/ml) or LukAB (15.6 ng/ml) with PBS or MβCD (2.5 or 5 mM) overtime. Mean ± SEM from three independent experiments, P values (one-way ANOVA) are shown. (G) Sulforhodamine B encapsulated liposome of POPC/sphingomyelin/cholesterol (w/w 4:1:1) were treated with purified PVL (1 µg/ml), LukF-PV, LukS-PV, saponin, or control PBS and fluorescence determined relative to Triton X-100 treatment. Mean ± SEM from three independent experiments. The data underlying this Figure can be found in S1 Data.
Fig 3
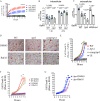
Fig 3. PVL internalization in human macrophages based on sphingolipid and cholesterol.
(A) Cell-surface levels of C5aR1 and LukS-PV in WT Cas9 THP-1 macrophages, SGMS1 knockout, and C5aR1 knockout clones using flow cytometry. Blue line represents isotype control treatment, red line antigen-specific staining. Data representative of four independent experiments. (B) Flow cytometric analysis and mean fluorescence intensity (MFI) of C5aR1 and LukS-PV from panel A. Mean ± SEM from four independent experiments. ns = not significant; P values are shown by one-way ANOVA followed by Dunnett’s multiple comparison test. (C) Localization of LukS-PV (red) in WT and SGMS1 KO macrophages treated with PVL (62.5 ng/ml) or LukS-PV (62.5 ng/ml) for 5 or 15 min. Plasma membrane was stained with DeepRed Cytopainter (green). White arrows indicate internalized LukS-PV signal. Scale bar is 20 µm. (D) WT and C5aR1-deficient human induced pluripotent stem cell (iPSC)-derived macrophages were treated with PVL (62.5 ng/ml; 5 or 15 min) and probed with anit-LukS-PV (red) and C5aR1 (green) antibodies, and nuclei stained with DAPI (blue). Scale bar is 20 µm. (E) Human iPSC-derived macrophages were treated with MβCD for 30 min prior to PVL exposure for 15 min. Cells were probed with anti-LukS-PV (green) and C5aR1 (red) antibodies. Scale bar is 20 µm. (F) Colony forming unit (CFU) of S. aureus in WT, SGMS1 KO, and C5aR1 KO human THP-1 macrophages, infected at an MOI of 10, at 1 and 4 h post infection (hpi). Mean ± SEM from six independent experiments. One-way ANOVA showed no statistical significance (n.s.). (G) Cell death (Draq7-positive) of WT, SGMS1 KO, and C5aR1 KO THP-1 macrophages after infection with S. aureus. Mean and ± SEM from three independent experiments. *** indicate P-value <0.01 (one-way ANOVA between WT and SGMS1 KO). The data underlying this Figure can be found in S1 Data.
Fig 4
Fig 4. PVL triggers lysosome and mitochondria permeabilization in human macrophages.
(A) PVL (62.5 ng/ml)-treated wild type (WT) human iPSC-derived macrophages were probed with anti-LukS-PV (green) and LAMP1 (red) antibodies, nuclei stained with DAPI (blue) at 1 and 5 min post-treatment. White arrows show co-localization of LukS-PV and LAMP1. Scale bar is 20 µm. The yellow line was used to generate pixel intensity and distance of LukS-PV (green) and LAMP1 (red). (B) WT and SGMS1 KO THP-1 macrophages were treated with PVL (62.5 ng/ml) and LysoTracker Red (red, acidic organelles) and Draq7 (blue, dead cells) fluorescence imaged over time. Yellow arrows indicate cells that loose LysoTracker Red signals prior to Draq7. Scale bar is 50 μm. Quantification of fluorescence intensity of LysoTracker Red and Draq7 in PVL and PBS control cells. Mean ± SEM from three independent experiments shown. (C) Quantification of Draq7 (dead cells, left panel) and LysoTracker Red staining (LTR, acidic organelles, right panel) of THP-1 macrophages exposed to PVL (62.5 ng/ml) and Ca-074Me or DMSO control overtime. Mean ± SEM from three independent experiments. ***P < 0.001, ns = not significant (one-way ANOVA). (D) Cell death (Draq7-positive, left panel) and LysoTracker Red (LTR, right panel) staining of THP-1 macrophages exposed to PVL and MCC950 or DMSO control overtime. Mean ± SEM from three independent experiments. **P < 0.01, ns = not significant (one-way ANOVA). (E) WT and SGMS1 KO THP-1 macrophages were treated with PVL (62.5 ng/ml) for the indicated time and MitoTracker TMRM (red) and Draq7 (blue) fluorescence imaged. Yellow arrows indicate the loss of TMRM signals prior to Draq7 uptake. Scale bar is 50 μm. Quantification of fluorescence intensity of TMRM (red) and Draq7 (blue) in PVL and PBS control cells. Mean ± SEM from three independent experiments shown. The data underlying this Figure can be found in S1 Data.
Fig 5
Fig 5. Intracellular replication of S. aureus in human macrophages.
THP-1 macrophages were stained with LysoTracker red (Lysosome) and infected with or without GFP-expressing S. aureus (MOI = 10) in the presence of Draq7 (dead macrophages). Data represents images from live-cell microscopy at indicated time points from three independent experiments. Pixel intensity and distance of LysoTracker (red) and GFP (green) along the yellow line are shown on the right. Scale bare = 10 µm. The data underlying this Figure can be found in S1 Data.
Fig 6
Fig 6. PVL and lysosomal acidification promotes S. aureus escape from human macrophages.
(A) Cell death (Draq7-positive) of THP-1 macrophages treated with PVL (62.5 ng/ml) and Bafilomycin A1 (BafA1, 100 nM) or DMSO control overtime. Mean ± SEM from three independent experiments. *P < 0.05 for PVL/DMSO vs. PVL/BafA1 at 1, 2, 11−14 h post toxin treatment; by unpaired t test. (B) Lysostaphin protection assay whereby THP-1 macrophages were infected with S. aureus WT and Δpvl (MOI = 10) and colony forming unit (CFU) determined at 1 h and 4 h post infection. Intracellular CFUs were derived from macrophages. Mean ± SEM from nine independent experiments shown. P-values from one-way ANOVA. (C) THP-1 macrophages were infected with WT, Δpvl, and complemented strain (compΔpvl) (MOI = 10) and extracellular bacterial numbers (CFU) determined in the supernatant after 4 h. Mean ± SEM from four independent experiments shown. P-values from one-way ANOVA. (D) THP-1 macrophages infected with WT, Δpvl, and compΔpvl S. aureus in the presence of MitoTracker TMRM (healthy mitochondria, bacteria, red) and Draq7 (dead macrophages, blue) were imaged with live-cell microscopy. Images taken at 4 h post infection. Yellow arrows indicate escaped intracellular bacteria stained with TMRM. Scale bar is 50 μm; Images representative of three independent experiments. (E) Cell death (Draq7 positive) of THP-1 macrophages infected with WT, Δpvl and compΔpvl S. aureus. Mean ± SEM from four independent experiments. * indicates P-value <0.01 (two-way ANOVA). (F, G) Cell death (Draq7 positive) of THP-1 macrophages infected with (F) WT or (G)pvl S. aureus and treated with BafA1 or DMSO. Mean ± SEM from four independent experiments. * indicates P-value <0.01 (two-way ANOVA). The data underlying this Figure can be found in S1 Data.

References

    1. Lee AS, de Lencastre H, Garau J, Kluytmans J, Malhotra-Kumar S, Peschel A, Harbarth S, et al.. Methicillin-resistant Staphylococcus aureus. Nat Rev Dis Primers. 2018;4:18033. doi: 10.1038/nrdp.2018.33 - DOI - PubMed
    1. DeLeo FR, Otto M, Kreiswirth BN, Chambers HF. Community-associated methicillin-resistant Staphylococcus aureus. Lancet. 2010;375(9725):1557–68. doi: 10.1016/S0140-6736(09)61999-1 - DOI - PMC - PubMed
    1. Spaan AN, van Strijp JAG, Torres VJ. Leukocidins: staphylococcal bi-component pore-forming toxins find their receptors. Nat Rev Microbiol. 2017;15:435–47. doi: 10.1038/nrmicro.2017.27 - DOI - PMC - PubMed
    1. Seilie ES, Wardenburg JB. Staphylococcus aureus pore-forming toxins: the interface of pathogen and host complexity. Semin Cell Dev Biol. 2017;72:101–16. doi: 10.1016/j.semcdb.2017.04.003 - DOI - PMC - PubMed
    1. Gillet Y, Issartel B, Vanhems P, Fournet JC, Lina G, Bes M, et al.. Association between Staphylococcus aureus strains carrying gene for Panton-Valentine leukocidin and highly lethal necrotising pneumonia in young immunocompetent patients. Lancet. 2002;359:753-59. - PubMed

MeSH terms

LinkOut - more resources