. 2025 Apr 15;18(882):eads2641.
doi: 10.1126/scisignal.ads2641. Epub 2025 Apr 15.

A drug that induces the microRNA miR-124 enables differentiation of retinoic acid-resistant neuroblastoma cells

Affiliations

A drug that induces the microRNA miR-124 enables differentiation of retinoic acid-resistant neuroblastoma cells

Lien D Nguyen et al. Sci Signal. .

Abstract

Tumor cell heterogeneity in neuroblastoma, a pediatric cancer arising from neural crest-derived progenitor cells, presents clinical challenges. Unlike adrenergic (ADRN) neuroblastoma cells, neuroblastoma cells with a mesenchymal (MES) identity are resistant to chemotherapy and retinoid therapy, which contributes to relapses and treatment failures. We explored whether up-regulation of the neurogenic, tumor suppressor microRNA miR-124 could promote the differentiation of retinoic acid-resistant MES neuroblastoma cells. Leveraging our screen for miRNA-modulatory small molecules, we identified and validated the tyrosine and phosphoinositide kinase inhibitor PP121 as a robust inducer of miR-124. Combining PP121 and BDNF-activating bufalin synergistically arrested proliferation and promoted the sustained differentiation of MES/heterogeneous SK-N-AS cells over several weeks. This protocol also resulted in the differentiation of multiple MES neuroblastoma and glioblastoma cell lines. RNA-seq analysis of differentiated MES/heterogeneous SK-N-AS cells revealed the replacement of the ADRN core regulatory circuitry with circuitries associated with chromaffin cells and Schwann cell precursors. Furthermore, differentiation was associated with inhibition of the CDK4/CDK6 pathway and activation of a transcriptional program that correlated with improved outcomes for patients with neuroblastoma. Our findings suggest an approach with translational potential to induce the differentiation of therapy-resistant cancers of the nervous system. Moreover, these long-lived, differentiated cells could be used to study mechanisms underlying cancer biology and therapies.


Conflict of interest statement

Competing interests: The authors have no conflicts of interest to declare.

Figures

Figure 1:
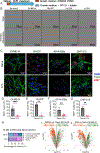
Figure 1:. PP121 upregulates miR-124 and drives differentiation of SK-N-AS cells.
(A) Representative images of SK-N-AS cells after transfection with control or miR-124 mimics (N=3 independent experiments). Scale bar is 100 µm. (B) Cell viability was measured with WST-1 viability assay. (C) Monolayer growth was quantified using live cell imaging. Data in (B) and (C) are means ± SD from 12 biological replicates per group. Statistical significance was determined using Kruskal-Wallis test, followed by Dunn’s multiple comparisons test. *P < 0.05, **P < 0.01, ***P < 0.005, and ***P < 0.0001. (D) Representative images of SK-N-AS cells after treatment with DMSO or PP121 (N=3 independent experiments). Scale bar is 100 µm. (E) Normalized confluence growth with the treatments (N=1 biological replicate per dose per drug, N=5 biological replicates for DMSO; for specific conditions, refer to source data). (F) qRT-PCR analysis for miR-124 in SK-N-AS cells after PP121 treatment. miR-124 expression was normalized to let-7a. Data are means ± SD n=4-6 biological replicates per concentration. Source data are provided in the source data file.
Figure 2:
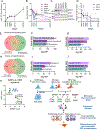
Figure 2:. PP121 and bufalin synergistically differentiate SK-N-AS cells
(A) Schematic of optimized differentiation protocol for SK-N-AS cells. (B) Representative images of cells over 30 days of differentiation (N=3 independent experiments). Scale bar is 100 µm. (C) Representative immunofluorescent images of naive and S2D14 cells. Scale bar is 50 µm. (D-E) Quantification of KI67-positive nuclei and TUJ1-positive processes. Data are means ± SD n=15 biological replicates over 3 independent experiments. Statistical significance was determined by unpaired two-tailed Mann-Whitney test. *P < 0.05, **P < 0.01, ***P < 0.005, and ***P < 0.0001. For (B) and (C), the white arrows point to neuron-like cells with small cell bodies and neurite-like processes; the yellow arrows point to senescent-like cells with enlarged cell bodies and no processes. Source data are provided in the source data file.
Figure 3:
Figure 3:. PP121/bufalin drives transcriptional changes associated with non-neuronal differentiation of SK-N-AS cells.
(A-C) Volcano plots comparing different stages of SK-N-AS differentiation. Significantly downregulated genes are colored blue, and significantly upregulated genes are colored red. D) Heatmap of all differentially expressed genes across four states. Z-score scaling was applied internally for each gene before K-means clustering. Numbers on the left indicate the cluster number, and numbers on the right indicate the number of genes in that cluster (refer to Table S3 for the complete list of genes in each cluster). (E) Top Reactome pathway enrichment analyses for each cluster in D. For all panels, N=4 biological replicates per group.
Figure 4:
Figure 4:. PP121/bufalin leads to a collapse of ADRN circuitry and a gain of MES circuitry.
(A-B) Averaged heatmap (N=4 biological replicates per group) for ADRN and MES TFs. Z-score scaling was applied internally for each gene. (C) ADRN and MES signature analysis for neuroblastoma cells. N=67 cell lines from GSE89969 and GSE90683, N=4 biological replicates per group from this study. (D) Representative immunofluorescent images for naïve and S2D14 SK-N-AS cells. Scale bar is 50 µm. (E-F) Quantification of PRRX1-positive and FOSL2-positive nuclei. Data are means ± SD from n=12 biological replicates over 2 independent experiments. Statistical significance was determined by unpaired two-tailed Mann-Whitney test. *P < 0.05, **P < 0.01, ***P < 0.005, and ***P < 0.001. (G) Representative Western blots of naïve and differentiated SK-N-AS cells over time. (H) Quantification of Western blots. GAPDH was used as the loading control. Data are means ± SD from n=4-6 biological replicates over 2 independent experiments. Source data and uncropped Western blots are provided in the source data file.
Figure 5:
Figure 5:. Differentiated SK-N-AS cells show a gain in TFs associated with chromaffin and SCP state.
(A-B) Shared down- and upregulated pathways among SK-N-AS cells differentiated with PP121/bufalin (N=4 biological replicates per group), and BE2C and NGP cells differentiated with RA (N =3 biological replicates per group from GSE155002). (C-D) RNA-seq data transcription factors associated with retino-sympathetic core regulatory circuitry and chromaffin cells. Gene expression was normalized to count per million (CPM). Data are means ± SD from n=4 biological replicates per group. (E) Deconvolution of bulk RNA-seq results of naïve and differentiated SK-N-AS cells. Data show means ± SD from N=4 biological replicates per group. Source data are provided in the source data file.
Figure 6:
Figure 6:. PP121/bufalin promotes the differentiation of multiple cell lines.
(A) Schematic of the one-step differentiation protocol. (B) Representative live cell images of SK-N-AS, GI-ME-N, SH-EP, LN-229, and U-251 cells after 16 weeks of differentiation (N=3 biological replicates). Scale bar is 100 µm. (C) Representative immunofluorescent images of naïve and D14 GI-ME-N, SH-EP, KP-N-SI9s, and CHP-212 cells. Scale bar is 50 µm. (D-G) Quantification of KI67-positive nuclei in GI-ME-N (N=10 biological replicates per group over 2 independent experiments), SH-EP, KP-N-SI9s, and CHP-212 (for each line, N=6 biological replicates per group) cells.. For (D-G), data show means ± SD. Statistical analyses were performed using unpaired two-tailed Mann-Whitney tests, *P < 0.05, **P < 0.01, ***P < 0.005, and ***P < 0.0001. (H) Deconvolution of bulk RNA-seq results of naïve and D30 differentiated GI-ME-N cells (N=3 biological replicates per group). (I-J) Volcano plots show gene expression changes in differentiated vs. naïve cells. Genes correlated with poor outcomes are in orange, genes correlated with good outcomes are in green, and non-correlated genes are in gray. Dunn test with Bonferroni correction was used to compare expression differences between categories (N=3-4 biological replicates per group). Source data are provided in the source data file.
Figure 7:
Figure 7:. Proposed possible mechanisms for PP121/bufalin-induced differentiation of MES-type neuroblastoma cells.
(A) qRT-PCR analysis for miR-124 during differentiation. miR-124 expression was normalized to let-7a. Data are means ± SD from n=4-6 biological replicates per group. (B) RNA-seq analyses for miR-124 targets and E2F1 during differentiation. Gene expression was normalized to count per million (CPM). Data are means ± SD from n=4 biological replicates per group. (C-D) Representative Western blots for miR-124 target and E2F1 and quantification. GAPDH was used as the loading control. Data are means ± SD from n=4 biological replicates per group. (E-G) Consensus molecular drug and gene CRISPR KO signatures for shared downregulated genes. (H-J) Consensus molecular drug and gene CRISPR KO signatures for shared upregulated genes. (K) ADRN and MES signature score for naïve and differentiated SK-N-AS and GI-ME-N cells. Data in (E-K) are from n=3-4 biological replicates per group. (L) Proposed mechanism for PP121/bufalin-induced differentiation of MES-type neuroblastoma cells. Source data and uncropped Western blots are provided in the source data file. Fig. 7L was created with BioRender.com.

Update of

References

    1. Whittle SB et al., Overview and recent advances in the treatment of neuroblastoma. Expert Rev Anticancer Ther 17, 369–386 (2017). - PubMed
    1. Cheung NK, Dyer MA, Neuroblastoma: developmental biology, cancer genomics and immunotherapy. Nat Rev Cancer 13, 397–411 (2013). - PMC - PubMed
    1. Ross RA, Spengler BA, Biedler JL, Coordinate morphological and biochemical interconversion of human neuroblastoma cells. J Natl Cancer Inst 71, 741–747 (1983). - PubMed
    1. Rettig WJ, Spengler BA, Chesa PG, Old LJ, Biedler JL, Coordinate changes in neuronal phenotype and surface antigen expression in human neuroblastoma cell variants. Cancer Res 47, 1383–1389 (1987). - PubMed
    1. Zeineldin M, Patel AG, Dyer MA, Neuroblastoma: When differentiation goes awry. Neuron 110, 2916–2928 (2022). - PMC - PubMed

MeSH terms