. 2025 May:115:105700.
doi: 10.1016/j.ebiom.2025.105700. Epub 2025 Apr 14.

HMGA1 deficiency: a pathogenic link between tau pathology and insulin resistance

Affiliations

HMGA1 deficiency: a pathogenic link between tau pathology and insulin resistance

Maria Mirabelli et al. EBioMedicine. 2025 May.

Abstract

Background: Growing evidence links tau-related neurodegeneration with insulin resistance and type 2 diabetes (T2D), though the underlying mechanisms remain unclear. Our previous research identified HMGA1 as crucial for insulin receptor (INSR) expression, with defects in the HMGA1 gene associated with insulin resistance and T2D. Here, we explore HMGA1 deficiency as a potential contributor to tauopathies, such as Alzheimer's disease (AD), and its connection to insulin resistance.

Methods: Immunoblot analyses, protein-DNA interaction studies, ChIP-qPCR, and reporter gene assays were conducted in human and mouse neuronal cell models. Tau immunohistochemistry, behavioural studies, and brain glucose metabolism were analysed in Hmga1-knockout mice. Additionally, a case-control study investigated the relationship between HMGA1 and tau pathology in patients with tauopathy, carrying or not the HMGA1 rs146052672 variant, known to reduce HMGA1 protein levels and increase the risk of insulin resistance and T2D.

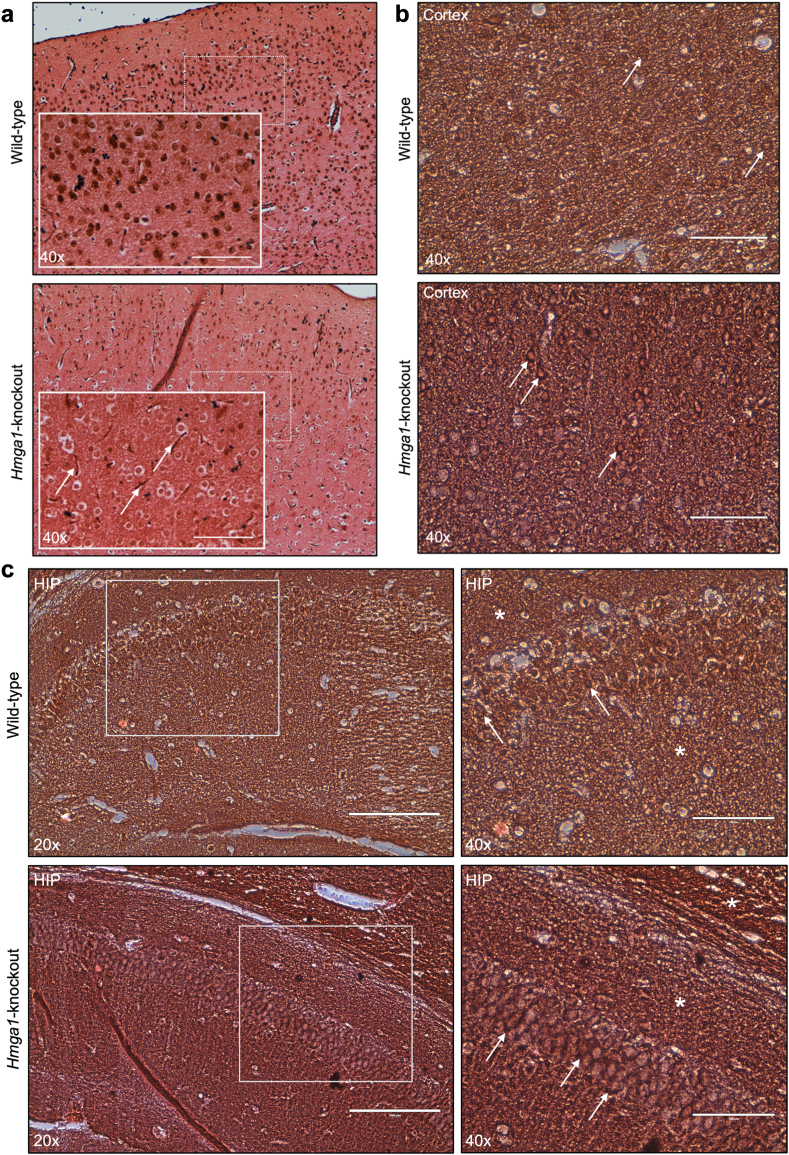
Findings: We show that HMGA1 regulates tau protein expression primarily through the specific repression of MAPT gene transcription. In both human neuronal cells and primary mouse neurons, tau mRNA and protein levels were inversely correlated with HMGA1 expression. This inverse relationship was further confirmed in the brain of Hmga1-knockout mice, where tau was overexpressed, INSR was downregulated, and brain glucose uptake was impaired. Additionally, the rs146052672 variant was more common in patients with tauopathy (12/69, 17.4%) than in controls (10/200, 5.0%) (p = 0.001), and carriers of this variant exhibited more severe disease progression and poorer therapeutic outcomes.

Interpretation: These findings suggest that HMGA1 deficiency may drive tau pathology, linking tauopathies to insulin resistance and providing new insights into the relationship between metabolic and neurodegenerative disorders. Furthermore, our observation that over 17% of individuals with tauopathy exhibit a deficit in HMGA1 protein production could have significant clinical implications, potentially guiding the development of therapeutic strategies targeting this specific defect.

Funding: See acknowledgements section.

Keywords: Gene transcription; Glucose metabolism; HMGA1; Insulin resistance; Neurodegeneration.


Conflict of interest statement

Declaration of interests The authors declare no competing interests.

Figures

Fig. 1
Fig. 1
Neuronal differentiation of SH-SY5Y human neuroblastoma cells and HMGA1 and tau expression. (a) Upper panels: representative optical microscopy images of SH-SY5Y cell morphology are shown at day 1, day 5, and day 10 after starting differentiation with RA. Lower panels: representative immunofluorescence microscopy images of tau protein (green fluorescence), nuclear DAPI (blue fluorescence), and merged signals at the same time points selected for the morphological analysis of SH-SY5Y cells, during differentiation. Scale bar = 20 μm. (b) HMGA1 and tau mRNA and protein expression were measured in both undifferentiated (Undiff.) and differentiated (Diff.) SH-SY5Y cells, using Western blot (WB) analysis and qRT-PCR. Values represent the mean ± s.e.m. of three independent experiments. ∗∗∗p < 0.001 versus undifferentiated cells, in each assay condition. The inset shows the progressive changes in HMGA1 and INSR expression over time (day 1, day 5, and day 10) following the initiation of differentiation with RA, as measured by WB. (c) HMGA1 and tau protein levels in the secretome of SH-SY5Y cells before and after neuronal differentiation. Left, representative WB of HMGA1 and tau in cell suspension (PBS) of undifferentiated (Undiff.) and differentiated (Diff.) SH-SY5Y cells. Ponceau S, protein loading control. Right, WB of HMGA1 in 24-h conditioned medium samples from undifferentiated (lanes 1–2) and differentiated (lanes 3–4) SH-SY5Y cells. A representative WB out of six independent experiments is shown. The absolute values of tau protein content in 24-h conditioned medium from undifferentiated (Undiff.) and differentiated (Diff.) SH-SY5Y cells are shown in bar graph (mean ± s.e.m.), together with the levels of p-tau (inset). ∗∗∗p < 0.001 versus undifferentiated cells. (d) Oxidative stress in undifferentiated (Undiff.) and differentiated (Diff.) SH-SY5Y cells. Left, Representative images of the MitoSOX Red Superoxide Indicator assay, showing red fluorescence, which indicates intracellular, mitochondrial-generated superoxide, overlaid with brightfield images. Scale bar = 100 μm. Right, Quantification of reactive oxygen species (ROS) production using the ROS-Glo™ H2O2 Assay. Data are expressed as mean ± s.e.m. of relative light units, normalized to the number of viable cells, from three independent experiments.
Fig. 1
Fig. 1
Neuronal differentiation of SH-SY5Y human neuroblastoma cells and HMGA1 and tau expression. (a) Upper panels: representative optical microscopy images of SH-SY5Y cell morphology are shown at day 1, day 5, and day 10 after starting differentiation with RA. Lower panels: representative immunofluorescence microscopy images of tau protein (green fluorescence), nuclear DAPI (blue fluorescence), and merged signals at the same time points selected for the morphological analysis of SH-SY5Y cells, during differentiation. Scale bar = 20 μm. (b) HMGA1 and tau mRNA and protein expression were measured in both undifferentiated (Undiff.) and differentiated (Diff.) SH-SY5Y cells, using Western blot (WB) analysis and qRT-PCR. Values represent the mean ± s.e.m. of three independent experiments. ∗∗∗p < 0.001 versus undifferentiated cells, in each assay condition. The inset shows the progressive changes in HMGA1 and INSR expression over time (day 1, day 5, and day 10) following the initiation of differentiation with RA, as measured by WB. (c) HMGA1 and tau protein levels in the secretome of SH-SY5Y cells before and after neuronal differentiation. Left, representative WB of HMGA1 and tau in cell suspension (PBS) of undifferentiated (Undiff.) and differentiated (Diff.) SH-SY5Y cells. Ponceau S, protein loading control. Right, WB of HMGA1 in 24-h conditioned medium samples from undifferentiated (lanes 1–2) and differentiated (lanes 3–4) SH-SY5Y cells. A representative WB out of six independent experiments is shown. The absolute values of tau protein content in 24-h conditioned medium from undifferentiated (Undiff.) and differentiated (Diff.) SH-SY5Y cells are shown in bar graph (mean ± s.e.m.), together with the levels of p-tau (inset). ∗∗∗p < 0.001 versus undifferentiated cells. (d) Oxidative stress in undifferentiated (Undiff.) and differentiated (Diff.) SH-SY5Y cells. Left, Representative images of the MitoSOX Red Superoxide Indicator assay, showing red fluorescence, which indicates intracellular, mitochondrial-generated superoxide, overlaid with brightfield images. Scale bar = 100 μm. Right, Quantification of reactive oxygen species (ROS) production using the ROS-Glo™ H2O2 Assay. Data are expressed as mean ± s.e.m. of relative light units, normalized to the number of viable cells, from three independent experiments.
Fig. 2
Fig. 2
Schematic representation of human and mouse MAPT genes and MAPT gene repression by HMGA1. (a) The gene structure of human (upper) and mouse (bottom) MAPT genes is shown. UTRs, exons/introns, and regulatory regions are shown for each gene. The regulatory regions, including the core promoter, the repressor C region, and the alternative promoter proximal to exon 1, are depicted by blue boxes in a left-to-right (5′ to 3′) orientation. The promoter regions proximal to exon 1 (red boxes), containing putative DNA binding sites for HMGA1, were used in reporter gene analysis and DNA-protein interaction studies. (b) Mouse (mMapt-Luc, left) or human (hMAPT-Luc, right) reporter vector and increasing amounts (0, 0.3, 0.6 μg) of pcDNA3-HMGA1a expression plasmid were cotransfected into terminally differentiated SH-SY5Y cells, in the absence or presence of 10 μM distamycin A. After 6 h of transfection, cells were treated with anti-HMGA1 siRNA (100 pmol), or a non-targeting control siRNA, and Luc activity was measured 48–96 h later. Values are expressed as the factors by which Luc activity increased or decreased as compared with the level of Luc activity obtained in transfections with the reporter vector alone (black bars), which is assigned an arbitrary value of 1. Open bar, pGL3-basic (vector without an insert). Data are the mean ± s.e.m. of triplicate assays from three independent experiments. ∗∗∗p < 0.001 versus control (black bar). Representative Western blots (WB) of HMGA1 in each condition are shown in the autoradiograms. (c) pcDNA3-HMGA1a effector vector was transfected into differentiated SH-SY5Y cells. After 6 h post-transfection, cells were treated with siRNA targeting HMGA1 (100 pmol) or control siRNA and endogenous tau mRNA expression was measured by qRT-PCR 48–96 h later. ∗∗∗p < 0.001 versus control siRNA. Representative WB of both tau and HMGA1 in each condition are shown in the autoradiograms, along with the densitometric analysis of the blots.
Fig. 3
Fig. 3
Binding of HMGA1 to MAPT promoter. (a) Top, schematic representation of the mouse Mapt gene with HMGA1 binding sites (blue uppercase) within the regulatory region (blue) of this gene. A 200 bp biotin-labelled Mapt promoter probe was used in EMSAs (bottom) with 1 μg of nuclear extracts (NE) from undifferentiated SH-SY5Y cells, in the presence of 1 μg poly (dI-dC) as nonspecific competitor. Lanes: 1, probe alone; 2, probe with NE; 3, competition with unlabelled oligonucleotide for the unrelated Sp1 transcription factor; 4, supershifting of the HMGA1-DNA complex (arrowhead), in the presence of anti-HMGA1 specific antibody (Ab). Lanes 5–6: distamycin A (10 μM) was preincubated with Mapt promoter probe (15 min at room temperature) before NE was added. Lane 7, NE from differentiated SH-SY5Y cells. Representative EMSAs are shown. Experiments were performed three times with similar results. (b) Top, schematic representation of the human MAPT gene with HMGA1 binding sites (blue uppercase) within the regulatory region (blue) of this gene. Bottom, representative ChIP of the MAPT gene locus in undifferentiated (Undiff.) and differentiated (Diff.) SH-SY5Y cells, either untreated or pretreated with distamycin A (10 μM), using an anti-HMGA1 specific antibody (Ab). qRT-PCR of ChIP-ed samples is shown in each condition. ∗∗∗p < 0.001 versus control (dotted bar).
Fig. 4
Fig. 4
Hmga1, tau and InsR expression in primary cultures of mouse neurons and in Hmga1-deficient mice. (a) Hmga1 and tau protein expression, as well as tau/InsR mRNA levels, were assessed in primary cultured neurons derived from wild-type mouse embryos. pcDNA3-HMGA1a expression plasmid or anti-HMGA1 siRNA (100 pmol) was transfected into cultured neurons and Hmga1 protein and tau/InsR mRNA were measured 48–96 h later. ∗p < 0.05, ∗∗p < 0.01 versus control siRNA-transfected cells. Data are shown as the mean ± s.e.m. of three independent experiments. (b) Hmga1, InsR and tau mRNA and protein expression (left) in cerebral tissues from wild-type (+/+) and Hmga1 knockout (−/−) mice. mRNA was measured by qRT-PCR and normalized to Rps9. Data from three independent assays from six animals per genotype are shown, together with representative Western blots (WB) of Hmga1, tau and p-tau (p-Tau1, Ser400/Thr403/Ser404; and p-Tau2, Thr205) (right) along with densitometric analysis of the blots. ∗∗p < 0.01, ∗∗∗p < 0.001 versus wild-type mice.
Fig. 5
Fig. 5
Brain IHC staining of tau and Glut3, behavioural studies, and FDG-PET in Hmga1-knockout and control mice. (a) IHC staining of paraffin-embedded cerebral cortex sections with anti-Hmga1 specific antibody. Compared to wild-type mice, the cerebral cortex of the Hmga1-knockout mice displays diffuse neuronal cytoplasmic vacuolization and an increased number of small blood-like vessels (white arrows), in the absence of Hmga1 protein brown staining. Scale bar = 100 μm. (b) IHC staining of cerebral cortex sections using an anti-tau specific antibody. Enhanced tau immunoreactivity in neuronal cell bodies (white arrows), is shown in Hmga1-knockout mice. Scale bar = 100 μm. (c) IHC staining of the hippocampus (HIP) with anti-tau-specific antibody shows similar enhanced tau immunoreactivity in both neuronal cell bodies (white arrows) and neuropil (white asterisks), as observed in the cerebral cortex of Hmga1-knockout mice. Scale bar = 200 μm at 20x magnification; Scale bar = 100 μm at 40x magnification. (d) Exploratory and freezing behaviours in wild-type (+/+) and Hmga1-knockout (−/−) mice. Histograms with error bars represent means ± s.e.m. of the total time spent engaging in exploratory activity (left) or in immobility (right) across 15 test sessions, each lasting 10 min (n = 3 animals per genotype); ∗p < 0.05, ∗∗p < 0.01 versus wild-type mice. (e) Representative images of IHC staining of Glut3 in brain cortex. Compared to Hmga1-knockout mice, wild-type animals show enhanced Glut3 brown staining immunoreactivity in neuronal cell bodies (white arrows). Scale bar = 100 μm. (f) Left, Western blots (WB) of Glut3 and Igf1R proteins in brain tissue of wild-type (+/+) and Hmga1-knockout (−/−) mice. Representative autoradiograms of six mice per genotype group are shown. Values of quantitative densitometric analyses of Glut3 and Igf1R immunoblots are shown in bar graphs. ∗∗∗p < 0.001 versus wild-type mice. Right, FDG-PET. Shown are scan images of a representative wild-type mouse (+/+) and a representative Hmga1-knockout mouse (−/−) 35 min after tracer administration. For each animal, quantitative assessment of whole brain FDG-uptake is indicated as the sum of integrated density of each slice, using a small region of interest positioned on the brain (B). Data are shown as the mean ± s.e.m. integrated density units, for four mice of each genotype.
Fig. 5
Fig. 5
Brain IHC staining of tau and Glut3, behavioural studies, and FDG-PET in Hmga1-knockout and control mice. (a) IHC staining of paraffin-embedded cerebral cortex sections with anti-Hmga1 specific antibody. Compared to wild-type mice, the cerebral cortex of the Hmga1-knockout mice displays diffuse neuronal cytoplasmic vacuolization and an increased number of small blood-like vessels (white arrows), in the absence of Hmga1 protein brown staining. Scale bar = 100 μm. (b) IHC staining of cerebral cortex sections using an anti-tau specific antibody. Enhanced tau immunoreactivity in neuronal cell bodies (white arrows), is shown in Hmga1-knockout mice. Scale bar = 100 μm. (c) IHC staining of the hippocampus (HIP) with anti-tau-specific antibody shows similar enhanced tau immunoreactivity in both neuronal cell bodies (white arrows) and neuropil (white asterisks), as observed in the cerebral cortex of Hmga1-knockout mice. Scale bar = 200 μm at 20x magnification; Scale bar = 100 μm at 40x magnification. (d) Exploratory and freezing behaviours in wild-type (+/+) and Hmga1-knockout (−/−) mice. Histograms with error bars represent means ± s.e.m. of the total time spent engaging in exploratory activity (left) or in immobility (right) across 15 test sessions, each lasting 10 min (n = 3 animals per genotype); ∗p < 0.05, ∗∗p < 0.01 versus wild-type mice. (e) Representative images of IHC staining of Glut3 in brain cortex. Compared to Hmga1-knockout mice, wild-type animals show enhanced Glut3 brown staining immunoreactivity in neuronal cell bodies (white arrows). Scale bar = 100 μm. (f) Left, Western blots (WB) of Glut3 and Igf1R proteins in brain tissue of wild-type (+/+) and Hmga1-knockout (−/−) mice. Representative autoradiograms of six mice per genotype group are shown. Values of quantitative densitometric analyses of Glut3 and Igf1R immunoblots are shown in bar graphs. ∗∗∗p < 0.001 versus wild-type mice. Right, FDG-PET. Shown are scan images of a representative wild-type mouse (+/+) and a representative Hmga1-knockout mouse (−/−) 35 min after tracer administration. For each animal, quantitative assessment of whole brain FDG-uptake is indicated as the sum of integrated density of each slice, using a small region of interest positioned on the brain (B). Data are shown as the mean ± s.e.m. integrated density units, for four mice of each genotype.
Fig. 6
Fig. 6
Total and p-tau and HMGA1 in CSF from patients with AD. (a) Levels of total tau (left) and p-tau (right) were measured in CSF from patients with AD, carrying the rs146052672 variant (n = 6) and wild-type AD patients (n = 12). (b) Left panel: Western blot (WB) of HMGA1 was performed on the CSF pool derived from six AD patients with the rs146052672 variant (lane 1) and twelve age- and sex-matched wild-type AD patients (lane 2), all of whom underwent lumbar puncture at the time of diagnosis. Right panel: immunoprecipitation (IP) of the CSF pool obtained from wild-type AD patients. Lanes: 1, pure CSF; 2, CSF following incubation with protein A/G agarose beads; 3, immunodepleted CSF supernatant following incubation with HMGA1 antibody-coupled protein A/G agarose beads; 4, immunoprecipitated HMGA1 protein following protein A/G-mediated recovery of the immuno-complex. Ponceau S staining was used as total protein loading control. Representative WBs of three independent assays are shown.
Fig. 7
Fig. 7
INSR expression and insulin binding in circulating blood monocytes. (a) Immunofluorescence of blood monocytes from AD patients, with and without the rs146052672 variant, fixed and stained with anti-INSR antibody. Representative immunofluorescence microscopy images of cell surface INSR protein (green fluorescence), nuclear DAPI (blue fluorescence), and merged signals. Scale bar = 2 μm. (b) Left: biotinylated insulin (B-Insulin) binding to the INSR was measured in intact monocytes from AD patients carrying (n = 6) or not carrying (n = 12) the HMGA1 variant. Fluorescence intensities are shown in bar graph (mean ± s.e.m.) for each HMGA1 genotype. Right, INSR expression was measured in monocytes from wild-type AD patient (n = 12) and AD variant carriers (n = 6), by Western blot (WB) analysis. A representative blot is shown, together with densitometric values (mean ± s.e.m). ∗∗p < 0.01, ∗∗∗p < 0.001.
Fig. 8
Fig. 8
Schematic illustration of the proposed model for the role of HMGA1 deficiency in the development of tauopathies. (a) The higher expression of HMGA1 in undifferentiated (Undiff.) SH-SY5Y cells turns off/slows down MAPT gene transcription, leading to a decline in tau mRNA and protein levels. Conversely, the decreased binding of HMGA1 to MAPT promoter in differentiated (Diff.) SH-SY5Y cells, ramps up MAPT gene transcription, with subsequent overexpression of total tau and tau hyperphosphorylation. (b) The in vitro model of MAPT gene regulation finds support in in vivo studies showing that tau protein expression is increased in the brain of Hmga1-knockout mice with signs of neuronal damage. (c) In humans, the HMGA1 rs146052672 variant, capable of reducing the expression levels of HMGA1, is associated with increased risk of tauopathies.

References

    1. Spillantini M.G., Schmidt M.L., Lee V.M., Trojanowski J.Q., Jakes R., Goedert M. Alpha-synuclein in Lewy bodies. Nature. 1997;388(6645):839–840. - PubMed
    1. Delacourte A. Tau pathology and neurodegeneration: an obvious but misunderstood link. J Alzheimers Dis. 2008;14(4):437–440. - PubMed
    1. Weingarten M.D., Lockwood A.H., Hwo S.Y., Kirschner M.W. A protein factor essential for microtubule assembly. Proc Natl Acad Sci U S A. 1975;72(5):1858–1862. - PMC - PubMed
    1. Alonso A.D., Cohen L.S. Our tau tales from normal to pathological behavior. J Alzheimers Dis. 2018;64(s1):S507–S516. - PubMed
    1. Ballatore C., Lee V.M., Trojanowski J.Q. Tau-mediated neurodegeneration in Alzheimer's disease and related disorders. Nat Rev Neurosci. 2007;8(9):663–672. - PubMed

LinkOut - more resources