. 2025 May 20;6(5):102078.
doi: 10.1016/j.xcrm.2025.102078. Epub 2025 Apr 14.

Tailoring an intravenously injectable oncolytic virus for augmenting radiotherapy

Affiliations

Tailoring an intravenously injectable oncolytic virus for augmenting radiotherapy

Chen Xu et al. Cell Rep Med. .

Abstract

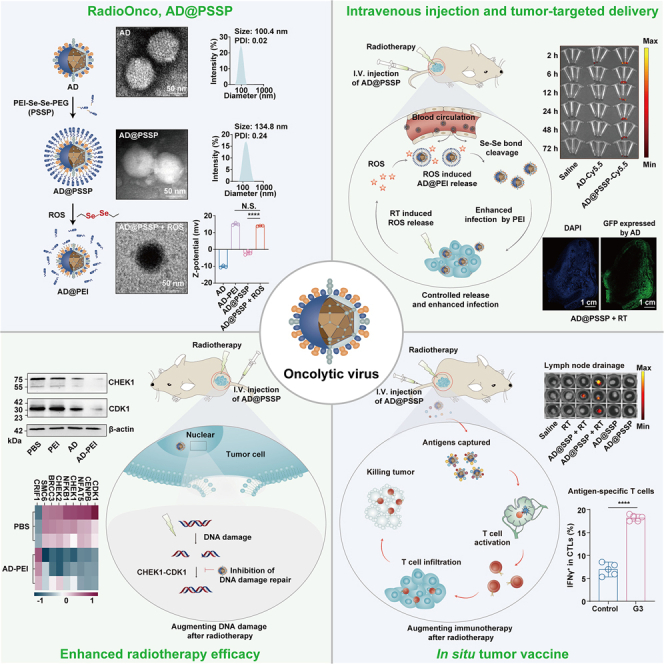
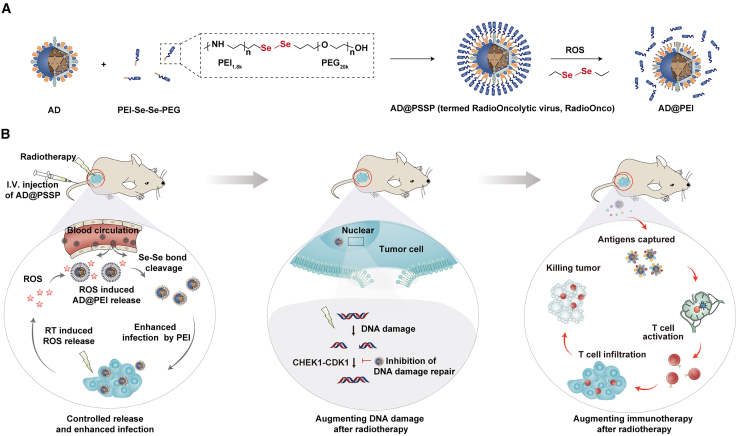
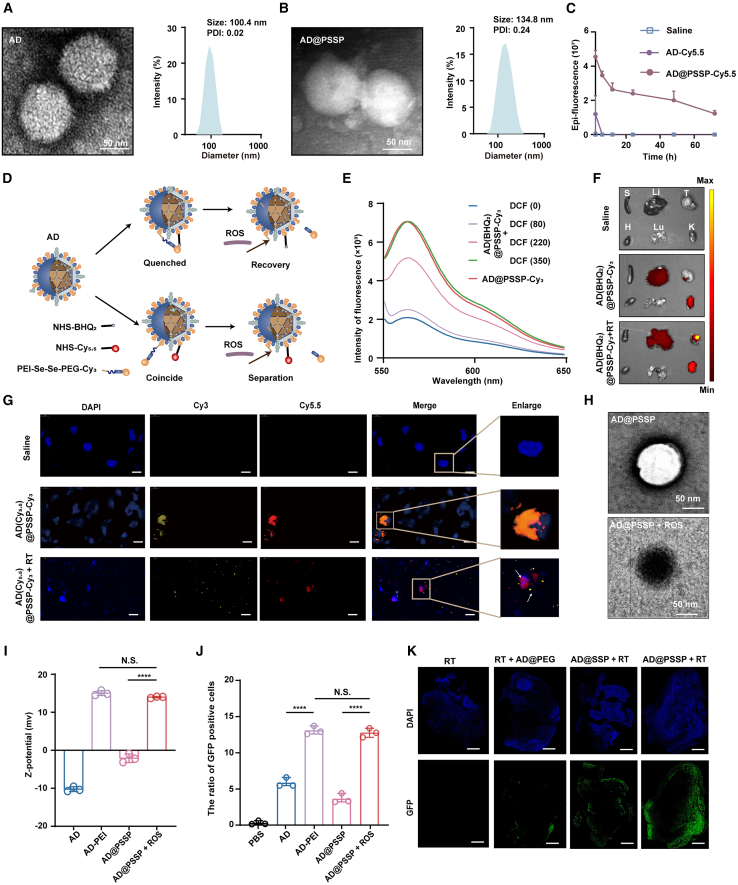
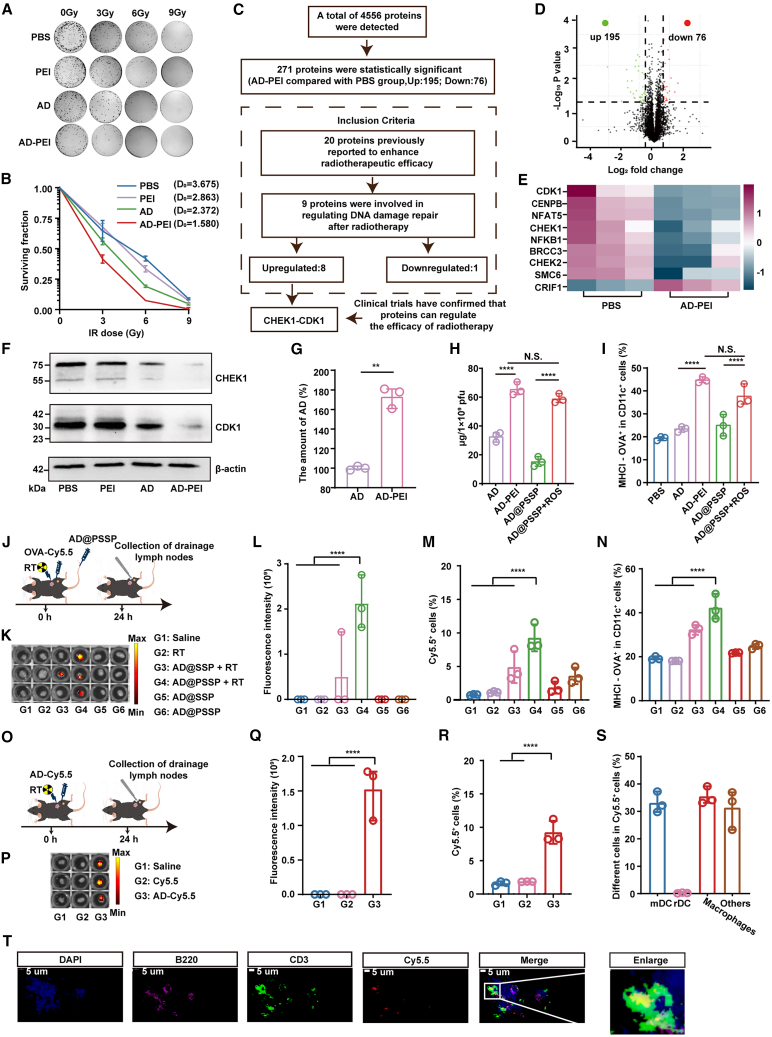
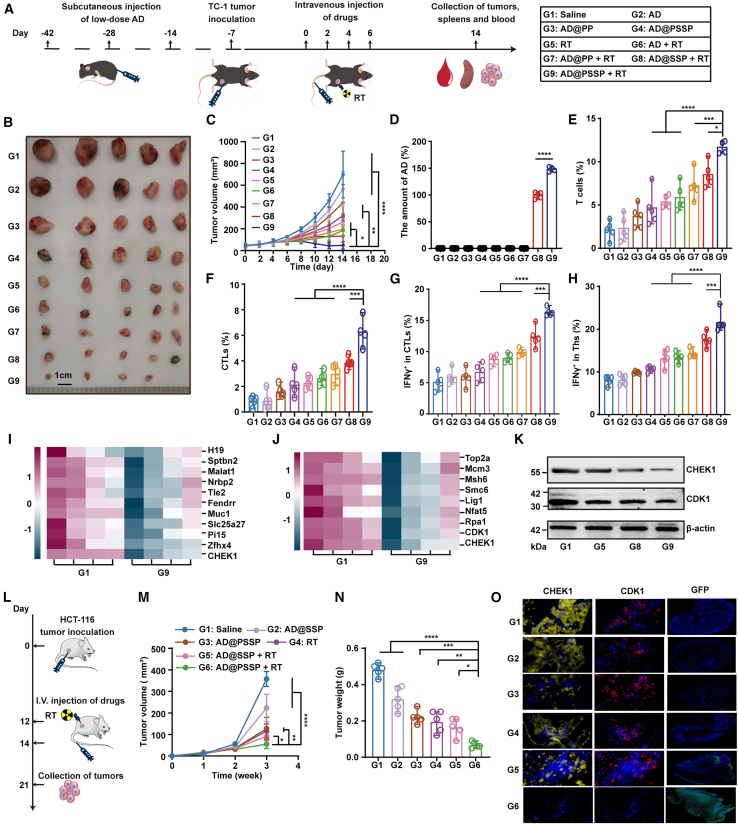
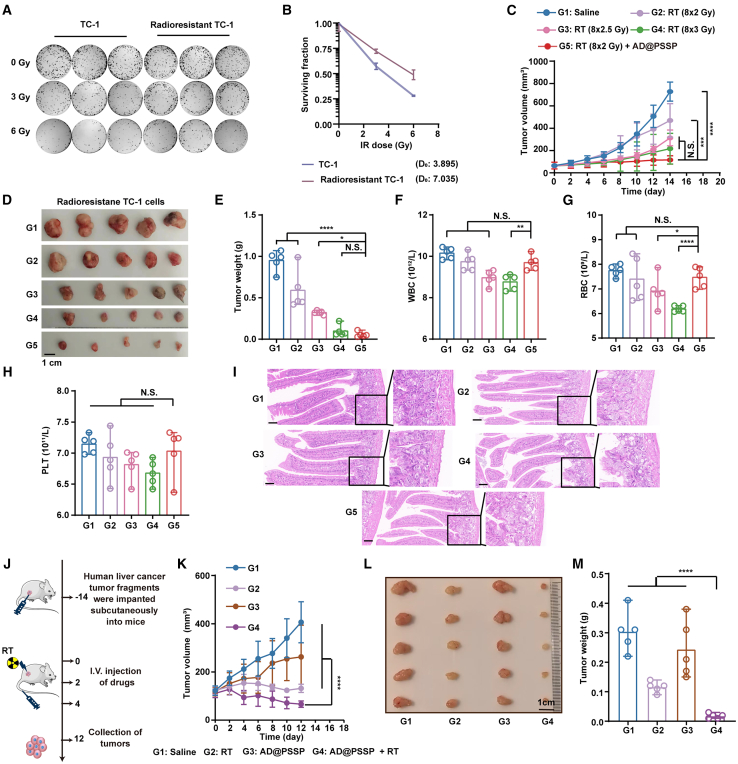
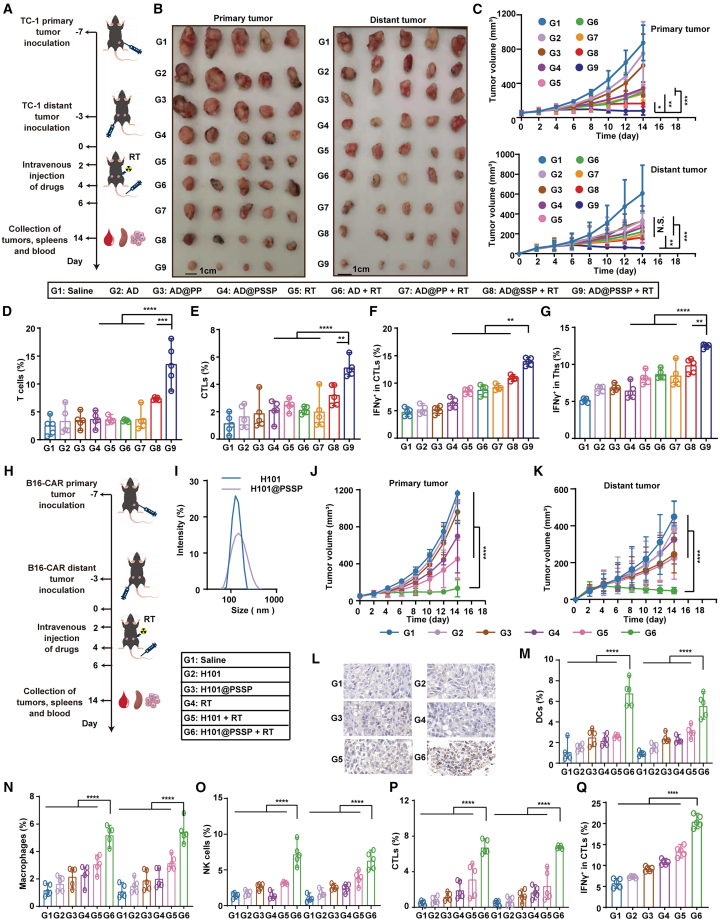
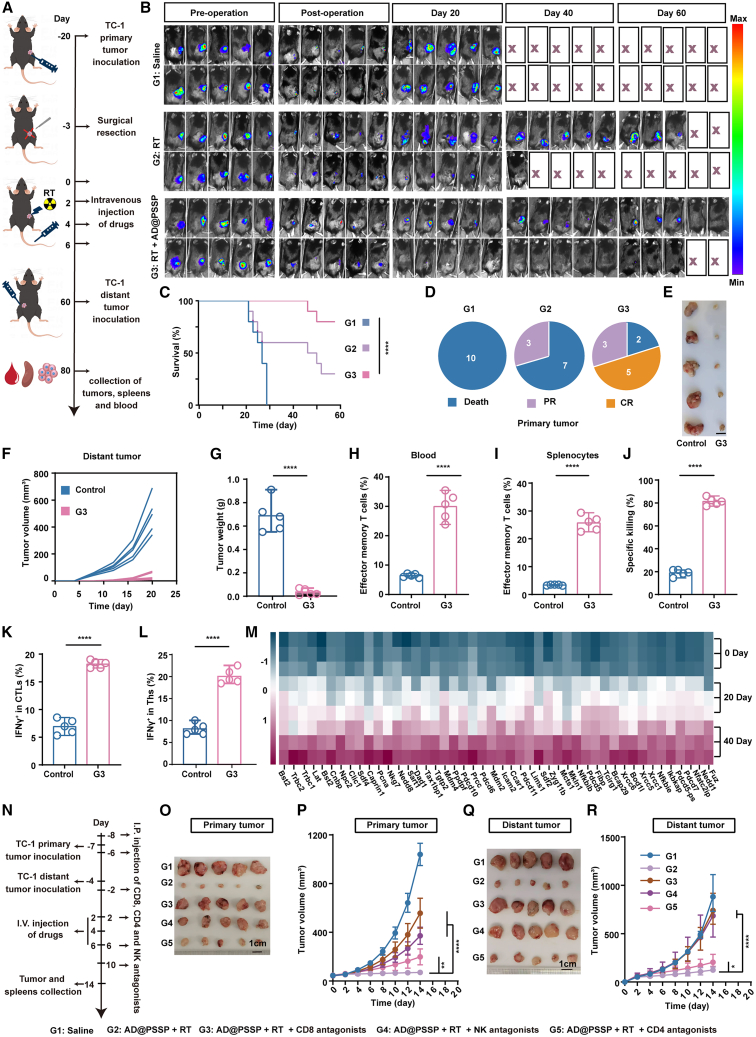
Oncolytic viruses (OVs) combined with radiotherapy (RT) show promise but are limited by challenges such as poor intravenous delivery and insufficient RT-induced DNA damage. In this study, an oncolytic adenovirus (AD) formulation, RadioOnco (AD@PSSP), is developed to improve delivery, infectivity, immune response, and RT efficacy. The multifunctional polyethylenimine (PEI)-selenium-polyethylene glycol (PEG) (PSSP) enhances intravenous delivery, shields the virus from rapid clearance, and enables targeted delivery to tumor sites after RT. The exposed PEI enhances the infectivity of AD through electrostatic interactions, thereby increasing DNA damage after RT by inhibiting the expression of DNA repair proteins, such as CHEK1 and CDK1. Furthermore, AD-PEI captures and delivers RT-induced tumor-released antigens to lymph nodes, activating robust anti-tumor immune responses. Animal model data demonstrate that RadioOnco overcomes RT resistance, targets distant metastases, and promotes long-term immunity, addressing metastasis and recurrence. In summary, this intravenously injectable OV enhances RT synergy through surface modification with multifunctional materials.

Keywords: DNA damage and repair; ROS-responsive materials; adenovirus; anti-tumor immune responses; antigen capture; oncolytic viruses; radiotherapy; radiotherapy resistance; radiotherapy sensitizer; synergistic therapy.


Conflict of interest statement

Declaration of interests The authors declare no competing interests.

Figures

None
Graphical abstract
Figure 1
Figure 1
Design and mechanism of action of RadioOncolytic virus (RadioOnco, AD@PSSP) (A) AD@PSSP is an OV platform designed for enhanced radiosensitization. The OV surface is modified with PEI-Se-Se-PEG, providing key benefits: (1) i.v. injectability, (2) increased infectivity, and (3) robust anti-tumor immune response. PEGylation prolongs circulation by preventing rapid clearance, while the ROS-sensitive Se-Se bond promotes PEG detachment and restores infectivity at the tumor site during low-dose RT. (B) The anti-tumor mechanisms of AD@PSSP in combination with RT. After i.v. injection, the PEGylated AD@PSSP extends its circulatory half-life. ROS produced at the tumor site following RT facilitates PEG shell shedding, which exposes the PEI component, enhancing viral infection via electrostatic interactions with tumor cells. Additionally, AD@PSSP inhibits the CHEK1-CDK1 pathway, suppressing the DNA damage repair response induced by RT. Moreover, AD@PSSP functions as an in situ tumor vaccine, using PEI to capture antigens, thereby boosting antigen-specific immune responses and promoting long-lasting immune memory.
Figure 2
Figure 2
Characterization and ROS-responsive performance of RadioOnco (A–C) TEM images and particle size distribution of AD (A) and AD@PSSP (B); scale bar, 50 nm. Polydispersity index (PDI) values are shown for both formulations. (C) Ex vivo fluorescence intensity of blood samples collected at various time points following i.v. injection of different formulations (n = 3). (D) Schematic illustration of ROS-responsive fluorescence probes based on AD@PSSP. Upper: AD was modified with PSSP-Cy3 and its black-hole quencher, NHS-BHQ2, to generate AD(BHQ2)@PSSP-Cy3. In this formulation, Cy3 fluorescence is quenched by BHQ2, and ROS-induced Se-Se bond cleavage restores Cy3 fluorescence. Bottom: AD tagged with NHS-Cy5.5 and PSSP-Cy3 (AD(Cy5.5)@PSSP-Cy3). ROS-mediated Se-Se bond disintegration leads to the separation of Cy3 and Cy5.5, facilitating fluorescence signal distinctness. (E) Fluorescence emission spectra of AD(BHQ2)@PSSP-Cy3 at varying concentrations of DCF. (F) Ex vivo fluorescence imaging of tumor tissues and major organs from TC-1 tumor-bearing mice 24 h post-i.v. administration of the indicated formulations. (G) Immunofluorescence staining of tumor tissues 24 h after i.v. injection of the indicated formulations and radiation. Scale bar, 10 μm (H) TEM images of AD@PSSP and ROS-treated AD@PSSP; scale bar, 50 nm (I) Zeta potential of different formulations (n = 3). (J) Transfection efficiency of different formulations for 14 h. GFP expression in TC-1 cells was determined by flow cytometry (n = 3). (K) Immunofluorescence staining of TC-1 tumors 24 h post-injection of different formulations, followed by radiation. GFP expression in infected TC-1 cells. Scale bar, 1 cm. Data are shown as mean ± SD and analyzed by Tukey’s post hoc test. N.S., not significant; ∗∗∗∗p < 0.0001.
Figure 3
Figure 3
RadioOnco as a radiosensitizer and in situ vaccine (A) Representative image of HCT-116 cell colonies after treatment with different agents and radiation doses. (B) Survival fraction of HCT-116 cells treated with different agents and radiation doses. The mean lethal dose (D0) was calculated for each treatment group based on the multi-target single-hit model (n = 3). (C–E) Proteomic analysis of HCT-116 cells treated with AD-PEI, followed by irradiation with three fractions of 6 Gy. (C) Flowchart outlining the process for screening differentially expressed proteins. (D) Differential protein expression in HCT-116 cells after treatment with AD-PEI, compared to PBS-treated controls (n = 3). (E)Relative abundance of DNA damage repair-related proteins in (D) (n = 3). (F) WB analysis of the CHEK1-CDK1 pathway in HCT-116 cells following treatment with AD-PEI and radiation (irradiated with 3 fractions of 6 Gy). β-actin was used as a loading control. (G) qPCR analysis of AD gene expression in HCT-116 cells from the AD and AD-PEI groups (n = 3). (H) Quantification of TDPs capture by different treatment groups (n = 3). (I) Antigen presentation by BMDCs following treatment with AD and AD-PEI, as quantified by flow cytometry (n = 3). (J) Schematic illustration of the experimental schedule for evaluating lymphatic drainage and antigen presentation by AD@PSSP. (K) Ex vivo fluorescence images of draining lymph nodes (n = 3). (L) Quantification of fluorescence intensity in the draining lymph nodes shown in (K) (n = 3). (M) Uptake of Cy5.5-labeled OVA by cells in lymph nodes, as determined by flow cytometry (n = 3). (N) Proportion of antigen-presenting DCs in the draining lymph nodes, assessed by flow cytometry (n = 3). (O) The schematic illustration of lymphatic drainage in AD following RT. (P and Q) Ex vivo fluorescence images (P) and fluorescence intensity (Q) of draining lymph nodes after injection of free Cy5.5 or AD-Cy5.5 (n = 3). (R) Flow cytometry analysis of Cy5.5+ cells in draining lymph nodes after injection of AD-Cy5.5 (n = 3). (S) Proportions of specific cell types within the Cy5.5+ population in draining lymph nodes (n = 3). (T) Immunofluorescence staining of draining lymph nodes at 24 h post-injection of AD-Cy5.5. B220 and CD3 antibodies were used to label B cell and T cell regions, respectively. Scale bar, 5 μm. Data are shown as mean ± SD and analyzed by Tukey’s post hoc test. N.S., not significant; ∗∗p < 0.01; ∗∗∗∗p < 0.0001.
Figure 4
Figure 4
Anti-tumor efficacy and mechanisms of AD@PSSP in combination with RT in murine models (A) Schematic representation of the experimental design to evaluate the anti-tumor effects of AD@PSSP combined with RT in C57BL/6 mice with pre-existing immunity to AD. (B and C) Tumor images (B) and tumor volume growth curves (C) on day 14 (n = 4–5). (D) Quantification of viral gene copies in tumor tissues via qPCR (n = 4–5). (E and F) Flow cytometric analysis of tumor-infiltrating T cells (E) and CTLs (F) at day 14 (n = 4–5). (G and H) Frequencies of IFNγ+ CTLs (G) and IFNγ+ Ths (H) in splenocytes after stimulation with TDPs (n = 5). (I and J) Transcriptomic and proteomic analysis of tumor tissues from G1 and G9 groups. (I) Heatmap of the top 10 most significantly altered genes, highlighting the differential expression of CHEK1 (n = 4). (J) Relative abundance of key proteins involved in DNA damage repair, including CHEK1 and CDK1 (n = 4). (K) WB analysis showing downregulation of CHEK1 and CDK1 in tumor tissues of the RT+AD@PSSP group. β-actin was used as control. (L) Schematic illustration of the experimental design for evaluating the anti-tumor efficacy of AD@PSSP combined with RT in immunodeficient BALB/c nude mice. (M and N) Tumor growth curves (M) and weights (N) were recorded (n = 5). (O) Immunofluorescence images of tumor tissues stained for CHEK1, CDK1, and GFP. Data are shown as mean ± SD and analyzed by Tukey’s post hoc test. N.S., not significant; ∗p < 0.05; ∗∗p < 0.01; ∗∗∗p < 0.001; ∗∗∗∗p < 0.0001.
Figure 5
Figure 5
Anti-tumor efficacy of AD@PSSP combined with RT in RT-resistant and PDX models (A–E) Evaluation of AD@PSSP combined with RT in RT-resistant TC-1 tumor-bearing mice. (A) Representative colony formation images of TC-1 and RT-resistant TC-1 cells exposed to escalating doses of irradiation (0, 3, 6 Gy) (n = 3). (B) Survival fractions of TC-1 and RT-resistant TC-1 cells at different radiation doses (n = 3). (C) Tumor growth curves in RT-resistant TC-1 tumor-bearing mice (n = 5). (D) Representative tumor images on day 14 post-treatment (scale bar, 1 cm) (n = 5). (E) Tumor weights measured on day 14 (n = 5). (F–H) Hematological analysis of white blood cell (WBC) counts (F), red blood cell (RBC) counts (G), and platelet (PLT) counts (H) on day 14, demonstrating no significant exacerbation of RT-induced myelosuppression by AD@PSSP (n = 5). (I) H&E staining of colorectal tissue sections, showing no evidence of radiation-induced enteritis across treatment groups (scale bar, 20 μm). (J–M) Assessment of AD@PSSP combined with RT in a PDX model of hepatocellular carcinoma. (J) Schematic representation of the experimental design to evaluate the anti-tumor effects of AD@PSSP combined with RT in PDX model. Tumor growth curves (K), representative tumor images (L), and tumor weights (M) in the PDX model, illustrating the superior therapeutic efficacy of the AD@PSSP+RT combination over other treatments (n = 5). Data are presented as mean ± SD. Statistical significance was determined using Tukey’s post hoc test. N.S., not significant; ∗p < 0.05; ∗∗p < 0.01; ∗∗∗p < 0.001; ∗∗∗∗p < 0.0001.
Figure 6
Figure 6
Systemic abscopal effects and immune activation elicited by AD@PSSP in combination with RT (A) Schematic representation of the experimental design to evaluate the abscopal effect and immunological mechanisms of AD@PSSP combined with RT. (B) Representative images of primary and distant tumors from treated mice (n = 4–5) on day 14 (scale bar, 1 cm). (C) Growth kinetics of primary and distant tumors across treatment groups (n = 4–5). (D and E) Flow cytometry quantification of T cells (D) and CTLs (E) in distant tumors at the study endpoint (n = 4–5). (F and G) Analysis of antigen-specific immune responses: IFNγ+ CTLs (F) and IFNγ+ Ths (G) in splenocytes re-stimulated with TDPs (n = 5). (H) Schematic overview of the experimental setup to assess the therapeutic efficacy of H101@PSSP combined with RT in a B16-CAR mouse model. (I) DLS analysis of H101 and H101@PSSP size distributions (n = 3). (J and K) Growth curves of primary (J) and distant (K) tumors across treatment groups in the B16-CAR model (n = 5). (L) Immunohistochemistry of hexon protein in primary tumors, demonstrating OV accumulation. (M–P) Quantification of immune cell infiltration in tumors via flow cytometry: DCs (M), macrophages (N), T cells (O), and CTLs (P). (Q) Flow cytometry analysis of IFNγ+ CTLs in splenocytes re-stimulated with TDPs, highlighting antigen-specific immune responses (n = 5). Data are presented as mean ± SD and analyzed using Tukey’s post hoc test. Statistical significance is denoted as follows: N.S., not significant; ∗p < 0.05; ∗∗p < 0.01; ∗∗∗p < 0.001; ∗∗∗∗p < 0.0001.
Figure 7
Figure 7
Long-term immune memory and critical immune mechanisms elicited by AD@PSSP combined with RT (A) Schematic illustration of the experimental procedure evaluating long-term immune memory induced by AD@PSSP combined with RT after surgery. (B) Bioluminescence imaging of primary tumors following surgery and treatment (n = 10). (C) Survival curves for mice under different treatment regimens (n = 10). (D) Analysis of primary tumors on days 60 (n = 10). CR, complete regression; PR, partial regression. (E) Representative images of distant tumors on day 80 (n = 5) (scale bar, 1 cm). (F and G) Growth curves (F) and tumor weight (G) of distant tumors were recorded (n = 5). (H and I) Proportions of effector memory T cells (Tem, CD3+CD8+CD44+CD62L) in blood (H) and splenocytes (I) on day 80, as determined by flow cytometry (n = 5). (J) Tumor-specific killing ability of splenocytes re-stimulated with TC-1 cells derived proteins on day 80, measured by CCK-8 assay (n = 5). (K and L) Flow cytometry analysis of IFNγ+ CTLs (K) and IFNγ+ Th cells (L) in splenocytes re-stimulated with TDPs (n = 5). (M) Heatmap of relative gene expression levels associated with T cell immune functionality and memory formation from single-cell RNA sequencing of CD3+T cells isolated from spleens on days 0, 20, and 40. (N) Experimental design for immune cell depletion models using monoclonal antibodies targeting CD4+ T cells, CD8+ T cells, or NK cells. (O–R) Primary tumor images (O), primary tumor growth curves (P), distant tumor images (Q), and distant tumor growth curves (R) in immune cell-depleted models treated with AD@PSSP and RT (n = 5). Log rank (Mantel-Cox) test was used for survival curve analysis. All other data are shown as mean ± SD and analyzed by Tukey’s post hoc test. N.S., not significant; ∗∗∗∗p < 0.0001.

Similar articles

Cited by

References

    1. Shalhout S.Z., Miller D.M., Emerick K.S., Kaufman H.L. Therapy with oncolytic viruses: progress and challenges. Nat. Rev. Clin. Oncol. 2023;20:160–177. doi: 10.1038/s41571-022-00719-w. - DOI - PubMed
    1. Lawler S.E., Speranza M.C., Cho C.F., Chiocca E.A. Oncolytic Viruses in Cancer Treatment: A Review. JAMA Oncol. 2017;3:841–849. doi: 10.1001/jamaoncol.2016.2064. - DOI - PubMed
    1. Lin D., Shen Y., Liang T. Oncolytic virotherapy: basic principles, recent advances and future directions. Signal Transduct. Target. Ther. 2023;8:156. doi: 10.1038/s41392-023-01407-6. - DOI - PMC - PubMed
    1. Huang Z., Guo H., Lin L., Li S., Yang Y., Han Y., Huang W., Yang J. Application of oncolytic virus in tumor therapy. J. Med. Virol. 2023;95 doi: 10.1002/jmv.28729. - DOI - PubMed
    1. Touchefeu Y., Vassaux G., Harrington K.J. Oncolytic viruses in radiation oncology. Radiother. Oncol. 2011;99:262–270. doi: 10.1016/j.radonc.2011.05.078. - DOI - PubMed