. 2025 May 14;5(5):100849.
doi: 10.1016/j.xgen.2025.100849. Epub 2025 Apr 14.

Enhanced interpretation of immune cell phenotype and function through a rhesus macaque single-cell atlas

Affiliations

Enhanced interpretation of immune cell phenotype and function through a rhesus macaque single-cell atlas

Eisa Mahyari et al. Cell Genom. .

Abstract

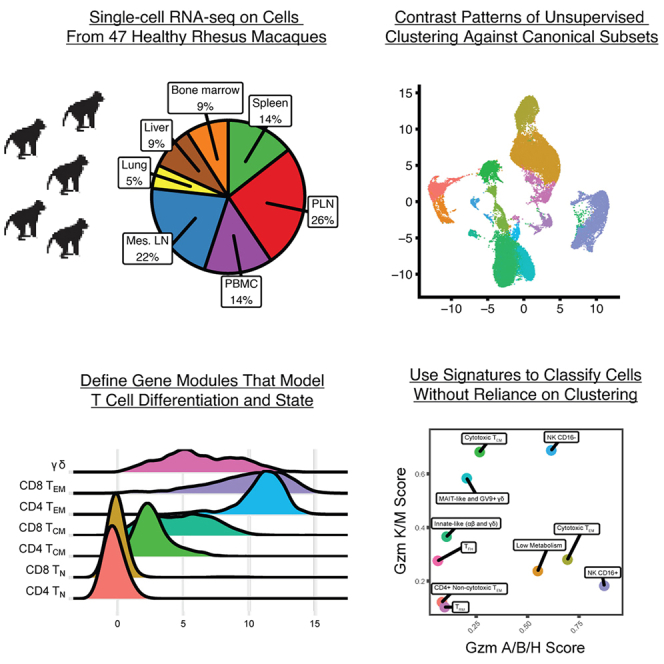
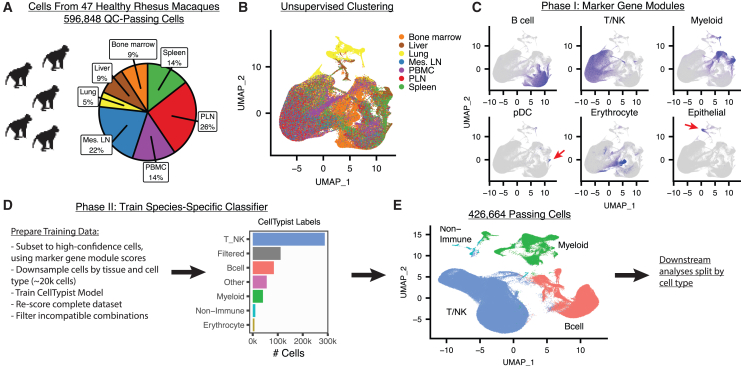
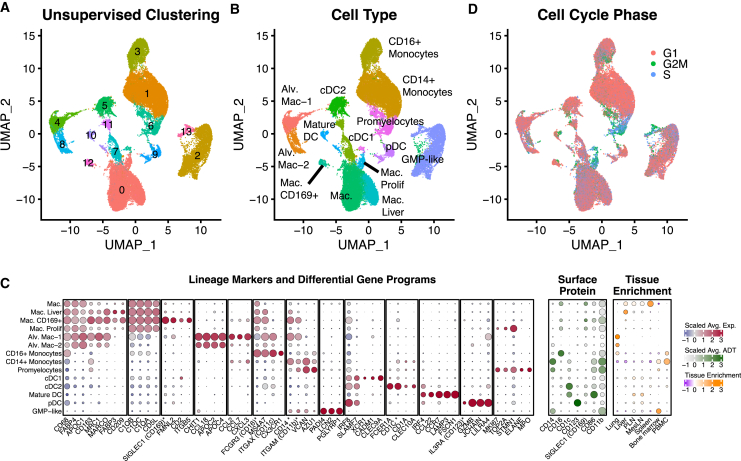
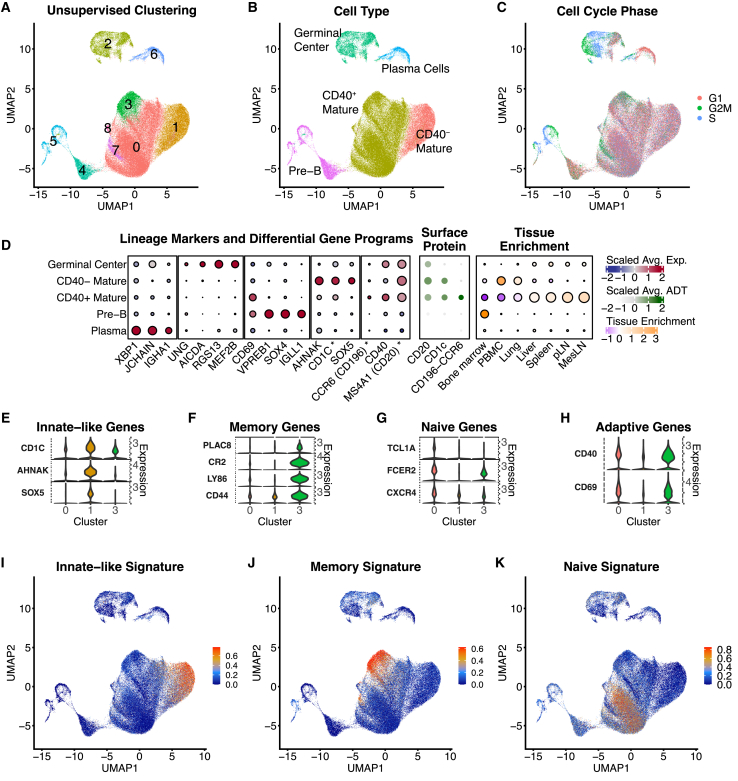
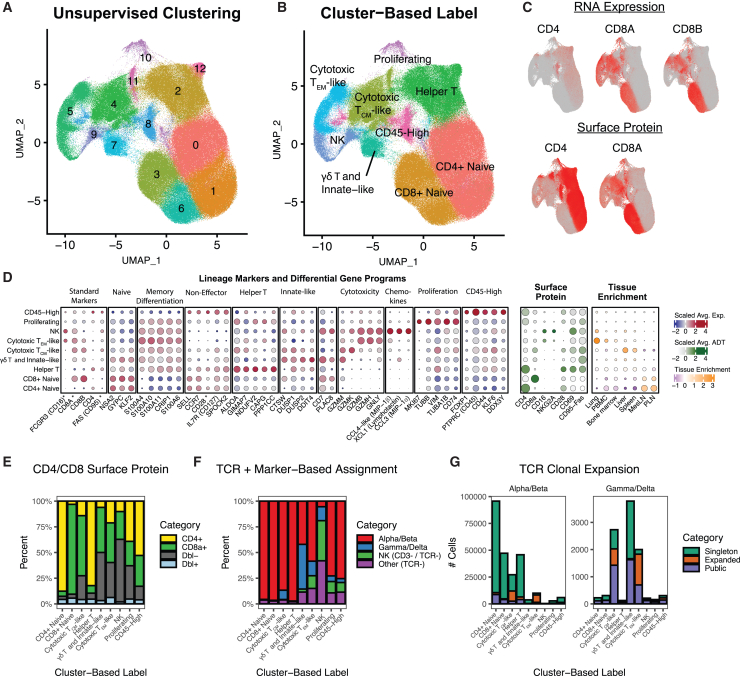
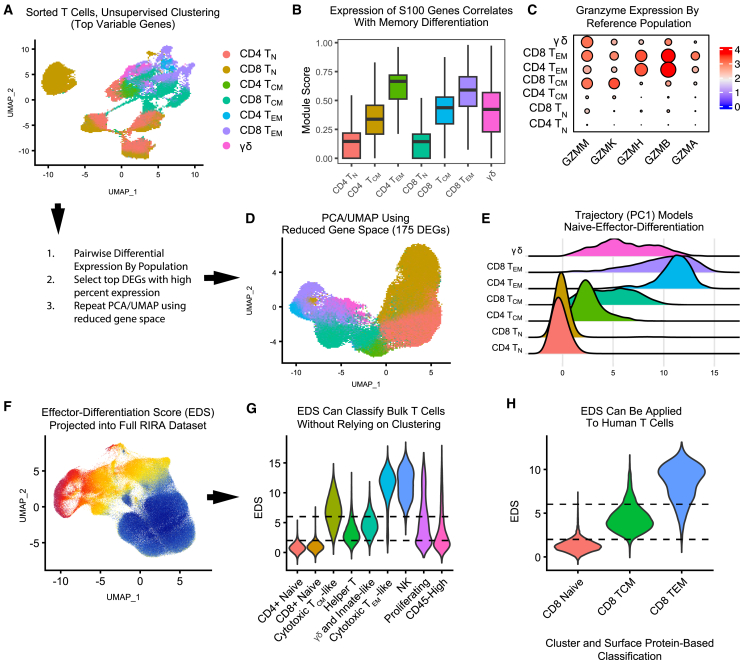
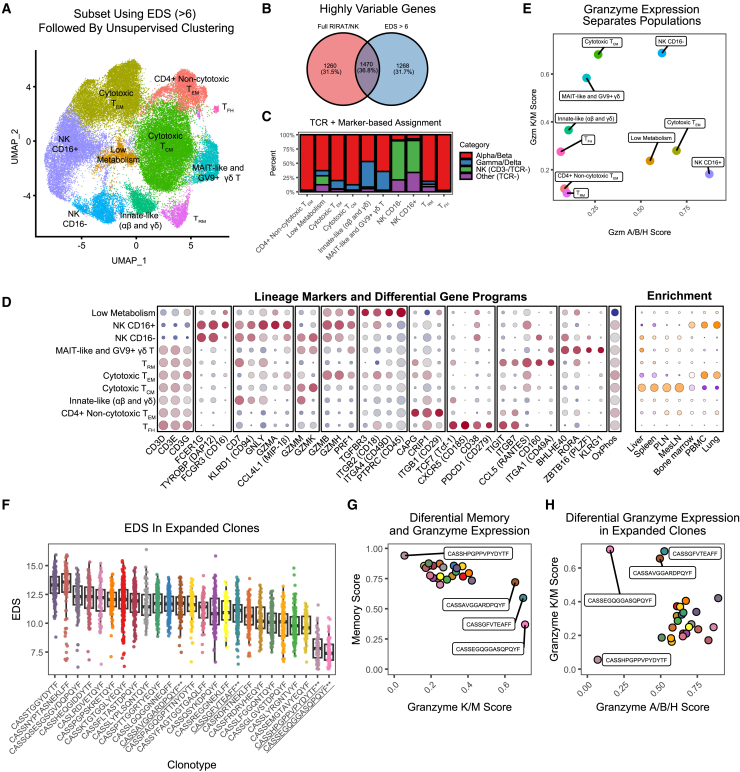
Single-cell RNA sequencing (scRNA-seq) allows cell classification using genome-wide transcriptional state; however, high-dimensional transcriptomic profiles, and the unsupervised analyses employed to interpret them, provide a systematically different view of biology than well-established functional/lineage definitions of immunocytes. Understanding these differences and limits is essential for accurate interpretation of these rich data. We present the Rhesus Immune Reference Atlas (RIRA), the first immune-focused macaque single-cell multi-tissue atlas. We contrasted transcriptional profiles against immune lineages, using surface protein and marker genes as ground truth. While the pattern of clustering can align with cell type, this is not always true. Especially within T and natural killer (NK) cells, many functionally distinct subsets lack defining markers, and strong shared expression programs, such as cytotoxicity, result in systematic intermingling by unsupervised clustering. We identified gene programs with high discriminatory/diagnostic value, including multi-gene signatures that model T/NK cell maturation. Directly measuring these diagnostic programs complements unsupervised analyses.

Keywords: T cells; immunology; rhesus macaque; single-cell RNA-seq.


Conflict of interest statement

Declaration of interests The authors declare no competing interests.

Figures

None
Graphical abstract
Figure 1
Figure 1
Overview of RIRA data and strategy for coarse cell type calling (A) The pie chart summarizes the input cells and tissues. (B) The UMAP plot displays unsupervised clustering of the preliminary data, colored by tissue. (C) As a first step toward identifying cell types, cells were scored for gene modules consisting of canonical lineage marker genes (listed in Table S3). The panel of UMAP plots is colored according to enrichment for the indicated gene modules. (D) To increase accuracy of cell type scoring, we subset cells from (C) with high-confidence calls, and down-sampled to create a training dataset. This training dataset was used to train a CellTypist classification model. The resulting model was used to label the entire dataset, with the results illustrated in the bar plot. (E) After removal of ambiguous and filtered cells, PCA/UMAP was repeated, and the resulting projection is shown, colored by coarse cell type.
Figure 2
Figure 2
Phenotypic characterization of RIRA myeloid cells (A) UMAP representation of the RIRA myeloid cell subset. Cells are colored by unsupervised clustering (Louvain). (B) Identical UMAP to (A), colored by phenotypic labels determined using differential gene expression and canonical marker genes. (C) The leftmost dot plot displays the top differentially expressed genes between the phenotypic classes shown in (B). The center dot plot displays surface protein expression for each group, and the rightmost dot plot displays tissue enrichment. Color scales correspond to column-scaled mean library-size-normalized RNA counts (RNA markers), column-scaled mean centered log ratio (CLR) normalized antibody-derived tag (ADT) counts (labeled surface protein), and linearly scaled chi-squared standardized residuals (tissue enrichment). Dot sizes correspond to fraction of cells expressing marker genes (RNA markers), fraction of cells positive for ADTs (surface protein), and fractional composition of tissues (tissue enrichment). Asterisks next to RNA feature names indicate the gene is also present in the surface protein section. (D) Identical UMAP plot to (A), colored based on cell-cycle phase.
Figure 3
Figure 3
Phenotypic characterization of RIRA B cells (A) UMAP representation of the RIRA B cell subset. Cells are colored by unsupervised clustering (Louvain). (B) Identical UMAP to (A), colored by phenotypic labels determined using differential gene expression and canonical marker genes. (C) Identical UMAP to (A), color based on cell-cycle phase. (D) The leftmost dot plot displays the top differentially expressed genes between the phenotypic classes shown in (B). The center dot plot displays surface protein expression for each group, and the rightmost dot plot displays tissue enrichment. Color scales correspond to column-scaled mean library-size-normalized RNA counts (RNA markers), column-scaled mean CLR-normalized ADT counts (surface protein), and linearly scaled chi-squared standardized residuals (tissue enrichment). Dot sizes correspond to fraction of cells expressing marker genes (RNA markers), fraction of cells positive for ADTs (surface protein), and fractional composition of tissues (tissue enrichment). (E–H) Violin plots show expression for a subset of genes whose expression differentiates sub-clusters within the primary cell types. (I–K) All B cells were scored for enrichment of gene modules corresponding to the genes in (E)–(G). (I)–(K) contain identical UMAP plots to (A), where each is colored according to enrichment for the indicated gene module.
Figure 4
Figure 4
Phenotypic characterization of RIRA T and NK cells (A) UMAP representation of the RIRA T and NK cell subset. Cells are colored by unsupervised clustering (Louvain). (B) Identical UMAP to (A), colored by phenotypic labels determined using differential gene expression and canonical marker genes. (C) Similar UMAP plots to (A), colored by the indicated RNA features (top row), or surface protein stain (bottom row). These panels illustrate the difference between RNA and protein detection, highlighting the limitation for CD4 RNA. (D) The leftmost dot plot displays the top differentially expressed genes between the phenotypic classes shown in (B), along with key marker genes. The center dot plot displays surface protein expression for each group, and the rightmost dot plot displays tissue enrichment. Color scales correspond to column-scaled mean library-size-normalized RNA counts (RNA markers), column-scaled mean CLR-normalized ADT counts (surface protein), and linearly scaled chi-squared standardized residuals (tissue enrichment). Dot sizes correspond to fraction of cells expressing marker genes (RNA markers), fraction of cells positive for ADTs (surface protein), and fractional composition of tissues (tissue enrichment). (E) The bar plot shows the percentage of cells from each phenotypic group defined in (B) that are positive for CD4 and/or CD8a protein, demonstrating that most cluster-based groups are heterogeneous, except for naive T cells. (F) A similar bar plot to (E), colored according to a categorization based on a combination of (1) presence of αβ and/or γδ TCR, and (2) presence of CD3 and/or CD16 RNA. As with (E), this illustrates that most cluster-based groups contain a mixture of functional subtypes. (G) The bar plots summarize TCR clonotype data per cluster-based group based on whether the clonotype is a “singleton” (detected in a single cell), “expanded” (detected in multiple cells in a single RM), or “public” (detected in more than one RM). Data are separated into alpha/beta and gamma/delta T cells.
Figure 5
Figure 5
Sorted reference T cell data and simplified statistic to model naive-to-memory differentiation Reference populations of T cells were fluorescence-activated cell sorting (FACS) sorted from PBMCs, followed by scRNA-seq. (A) The UMAP plot displays dimensionality reduction of 56,637 sorted reference T cells, colored by population. Dimensionality reduction was performed on the top 3,000 variable genes. (B) Per-cell enrichment was calculated for a gene module consisting of S100A proteins. The boxplot displays the range of this score by reference population. (C) The dot plot displays the pattern of granzyme expression within each reference population. (D) Pairwise differential gene expression contrasts were performed by population to identify the top marker genes per population. The UMAP plot displays dimensionality reduction in this reduced gene space using the 175 top marker genes for these populations. (E) PC1 from (D) was imputed into the sorted cells. The plot displays the range of these scores, illustrating the separation of the reference populations. (F) To test the generalizability of this statistic, the same principal component was imputed into the full RIRA dataset. The UMAP plot displays this effector-differentiation score (EDS). (G) The same scores as in (F) are displayed as a violin plot. The dotted lines illustrate representative thresholds that could be used to subset data to remove naive T cells or limit to effector-differentiated cells. (H) The EDS was used to score peripheral T cells from a public human dataset, demonstrating applicability across species. Collectively, these data demonstrate that S100A proteins and granzyme expression have predictive power to separate T cell subsets and further show that the EDS, which was modeled using reference peripheral T cells, provides a transferable statistic to quantify naive-to-effector differentiation in T cell datasets.
Figure 6
Figure 6
Analysis of effector-differentiated T and NK cells (A) The UMAP plot displays dimensionality reduction of RIRA T/NK cells, after limiting to cells with EDS > 6. (B) The Venn diagram shows the overlap between the top 3,000 variable genes, which is the input to PCA/UMAP, computed on the total RIRA T/NK dataset as compared to this subset. This highly different gene space is one of the reasons for different pattern of clustering at this resolution. (C) The bar plot summarizes each cluster/phenotype based on a combination of (1) presence of αβ and/or γδ TCR, and (2) presence of CD3 and/or CD16 RNA. This illustrates that many cluster-based groups contain a mixture of functional subtypes. (D) The leftmost dot plot displays the top differentially expressed genes between the phenotypic classes shown in (A), along with key marker genes. The rightmost dot plot displays tissue enrichment. Color scales correspond to column-scaled mean library-size-normalized RNA counts (RNA markers) and linearly scaled chi-squared standardized residuals (tissue enrichment). Dot sizes correspond to fraction of cells expressing marker genes (RNA markers) and fractional composition of tissues (tissue enrichment). (E) Cells were scored for enrichment of granzymes K/M and granzymes A/B/H using the UCell module. The graph displays the mean of each score per cluster, demonstrating that these modules have predictive power among many effector subsets. (F) The top 25 most expanded TCRβ clonotypes were selected. The boxplot displays the EDS of each cell. These data illustrate that most clones are highly effector differentiated, although two outliers exist. Clones labeled in (G) and (H) are underlined, and colors are preserved in (F)–(H). (G) The plot displays the mean memory score (defined by S100A proteins) compared to the granzyme K/M score. Clones with atypical profiles are labeled. (H) The plot displays the mean granzyme K/M and mean granzyme A/B/H score for each clone. As in (G), atypical clones are labeled.

Similar articles

References

    1. Murphy K., Weaver C. 9th edition. Garland Science/Taylor & Francis Group, LLC; 2016. Janeway's Immunobiology.
    1. Marsh-Wakefield F.M., Mitchell A.J., Norton S.E., Ashhurst T.M., Leman J.K., Roberts J.M., Harte J.E., McGuire H.M., Kemp R.A. Making the most of high-dimensional cytometry data. Immunol. Cell Biol. 2021;99:680–696. doi: 10.1111/imcb.12456. - DOI - PMC - PubMed
    1. Arad G., Geiger T. Functional Impact of Protein-RNA Variation in Clinical Cancer Analyses. Mol. Cell. Proteomics. 2023;22 doi: 10.1016/j.mcpro.2023.100587. - DOI - PMC - PubMed
    1. Gry M., Rimini R., Strömberg S., Asplund A., Pontén F., Uhlén M., Nilsson P. Correlations between RNA and protein expression profiles in 23 human cell lines. BMC Genom. 2009;10:365. doi: 10.1186/1471-2164-10-365. - DOI - PMC - PubMed
    1. Mullan K.A., de Vrij N., Valkiers S., Meysman P. Current annotation strategies for T cell phenotyping of single-cell RNA-seq data. Front. Immunol. 2023;14 doi: 10.3389/fimmu.2023.1306169. - DOI - PMC - PubMed

LinkOut - more resources