. 2025 Apr 15;11(1):177.
doi: 10.1038/s41420-025-02485-x.

ATM knock out alters calcium signalling and augments contraction in skeletal muscle cells differentiated from human urine-derived stem cells

Affiliations

ATM knock out alters calcium signalling and augments contraction in skeletal muscle cells differentiated from human urine-derived stem cells

Giulia Dematteis et al. Cell Death Discov. .

Abstract

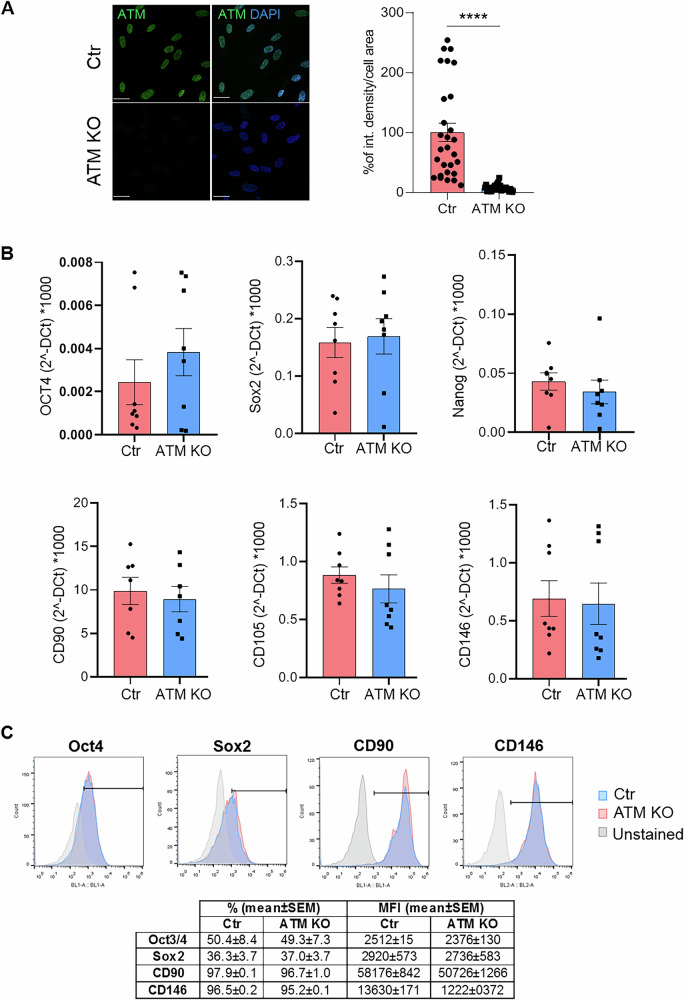
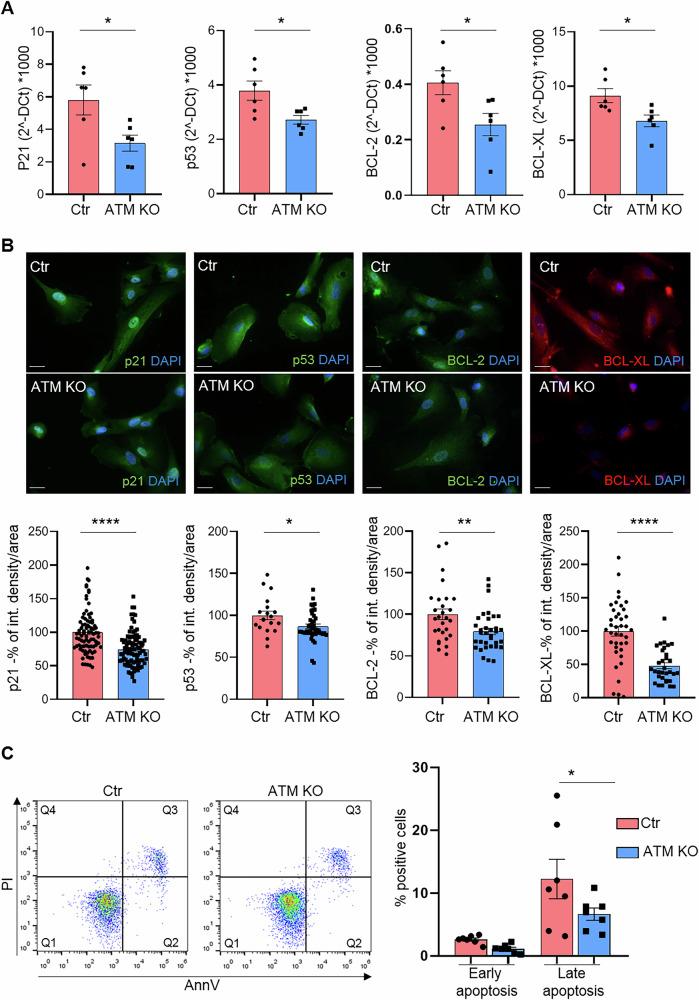
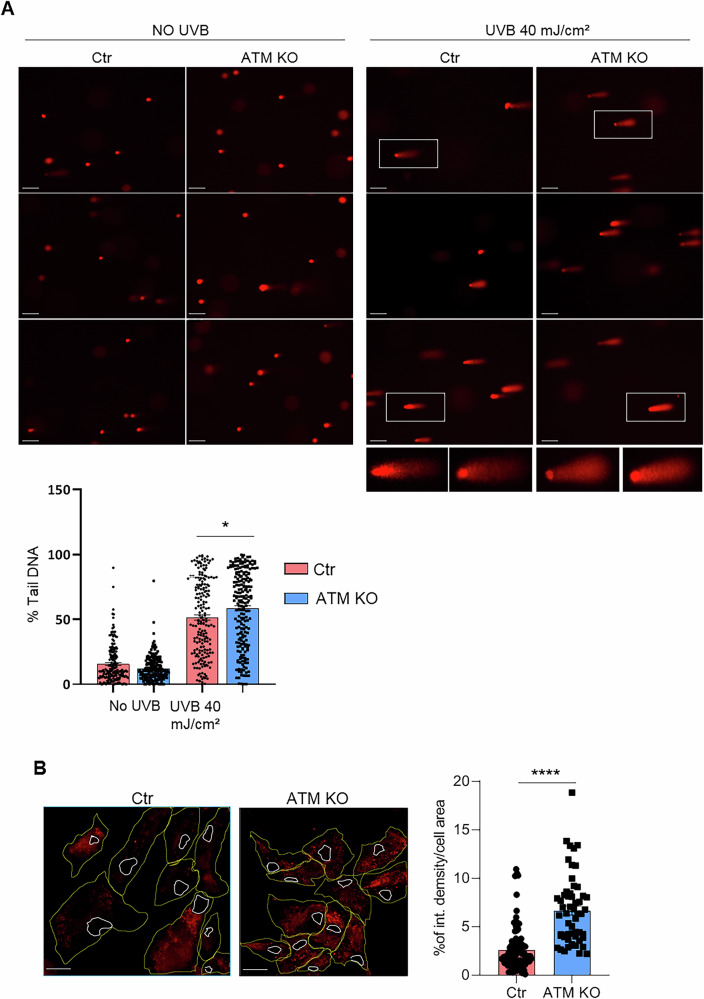
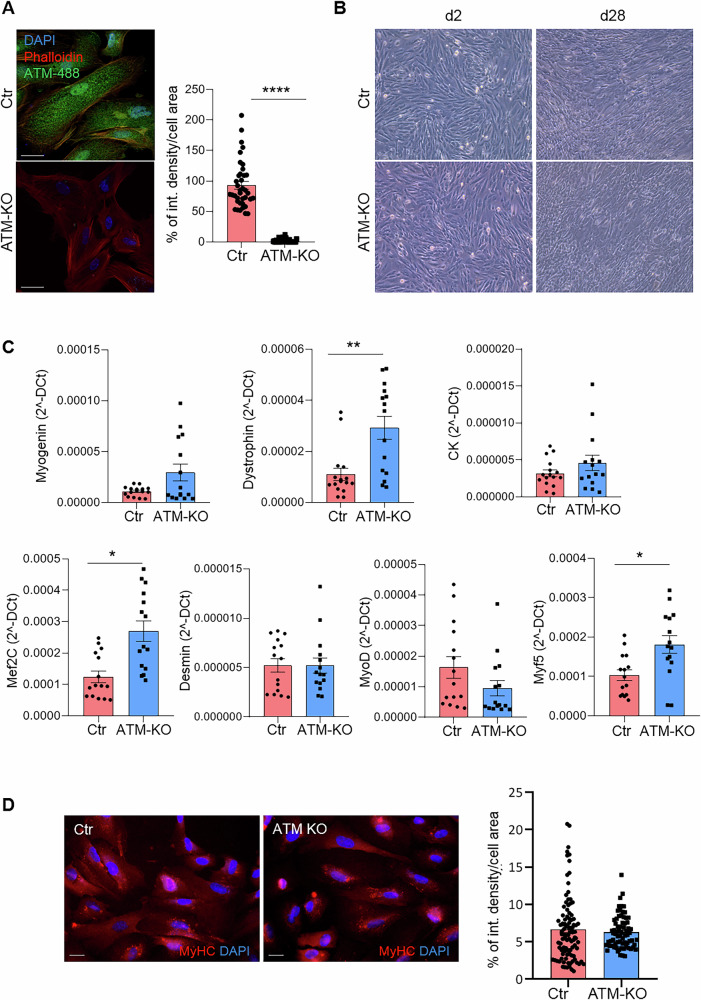
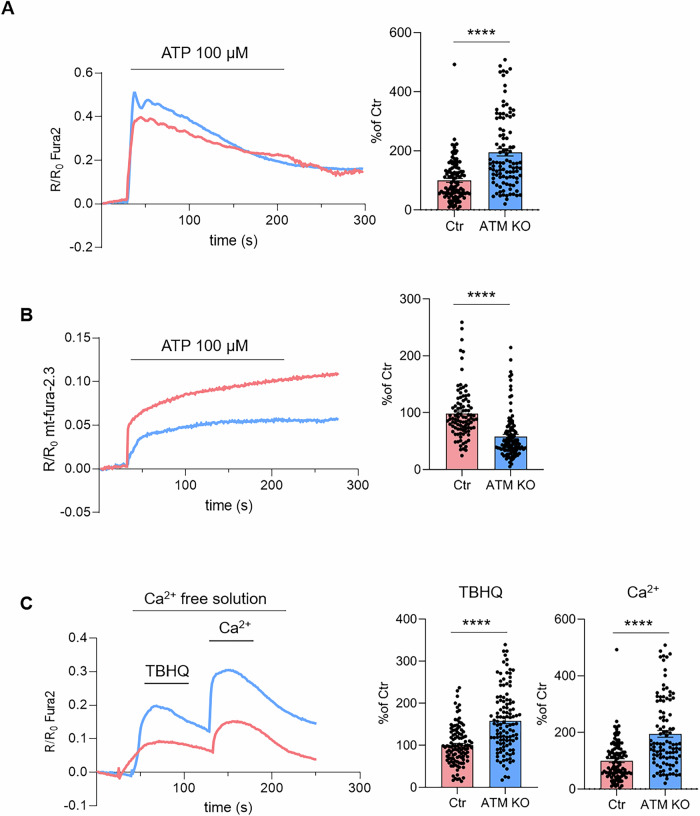
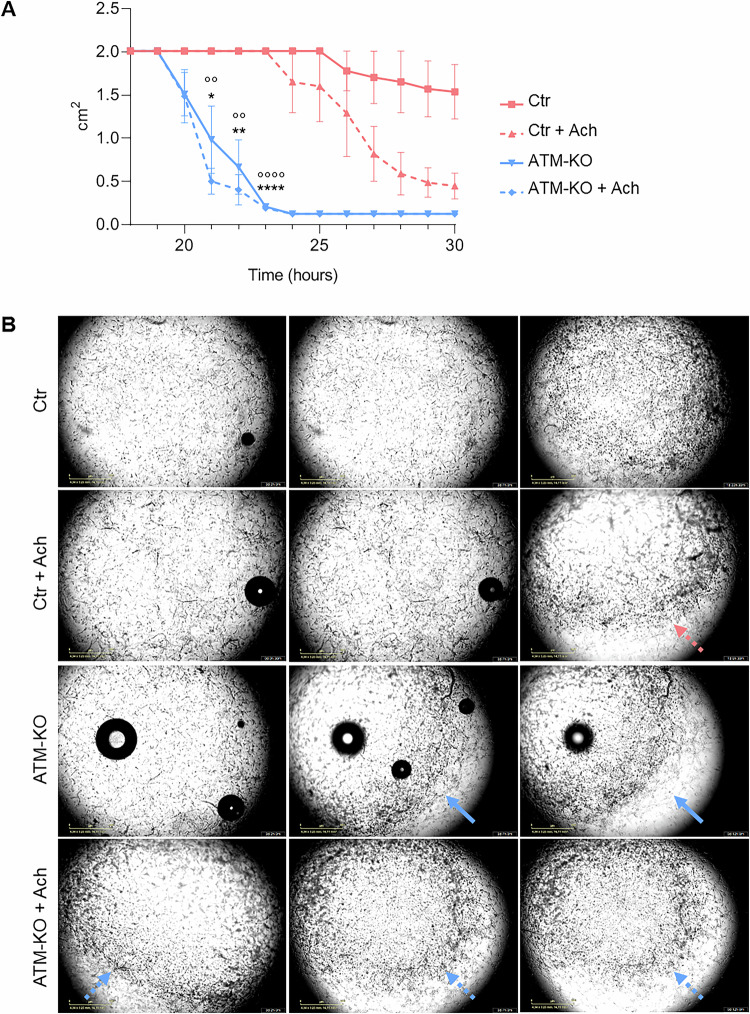
Ataxia-telangiectasia (A-T) is a rare neurodegenerative disorder caused by the deficiency of the serine/threonine kinase ataxia telangiectasia mutated (ATM) protein, whose loss of function leads to altered cell cycle, apoptosis, oxidative stress balance and DNA repair after damage. The clinical manifestations are multisystemic, among them cerebellar degeneration and muscular ataxia. The molecular mechanism by which ATM loss leads to A-T is still uncertain and, currently only symptomatic treatments are available. In this study, we generated a functional skeletal muscle cell model that recapitulates A-T and highlights the role of ATM in calcium signalling and muscle contraction. To this aim, by using CRISPR/Cas9 technology, we knocked out the ATM protein in urine-derived stem cells (USCs) from healthy donors. The resulting USCs-ATM-KO maintained stemness but showed G2/S cell cycle progression and an inability to repair DNA after UV damage. Moreover, they showed increased cytosolic calcium release after ATP stimulation to the detriment of the mitochondria. The alterations of calcium homoeostasis were maintained after differentiation of USCs-ATM-KO into skeletal muscle cells (USC-SkMCs) and correlated with impaired cell contraction. Indeed, USC-SkMCs-ATM-KO contraction kinetics were dramatically accelerated compared to control cells. These results highlight the relevant function of ATM in skeletal muscle, which is not only dependent on a non-functional neuronal communication, paving the way for future studies on a muscular interpretation of A-T ataxia.


Conflict of interest statement

Competing interests: The authors declare no competing interests.

Figures

Fig. 1
Fig. 1. Characterization of USCs-ATM-KO.
A Representative IF analysis of ATM expression in non-transfected USCs-Ctr and USCs-ATM-KO (Magnification 63X; scale bar= 20 µm; Green: ATM; Blue: DAPI) and relative fluorescence quantification. Data are expressed as % of integrated density/cell area and are the mean ± SEM of 28 cells of 3 independent experiments. B qPCR analysis of stem (Oct4, Sox2, Nanog) and mesenchymal (CD90, CD105, CD146) markers. Data are mean ± SEM of 8 independent experiments. C FACS analysis of Oct4, Sox2 CD90, and CD146. Data are shown as representative superimposed histograms and, in table, as mean ± SEM of at 4 independent experiments.
Fig. 2
Fig. 2. USCs-ATM-KO altered apoptosis.
A Real-time PCR analysis of apoptosis-related genes. Data are expressed as 2-ΔCt*1000 and are mean ± SEM of 6 independent experiments. *p < 0.05 vs USCs-Ctr. B Representative IF analysis of apoptosis-related markers expression in USCs-Ctr and USCs-ATM-KO (Magnification 40X; scale bar= 25 μm) and relative fluorescence quantification. Data are expressed as % of integrated density/cell area and are the mean ± SEM of cells from 3 independent experiments. C FACS analysis of apoptosis. Cells were stained with Annexin V and propidium iodide (PI) and the fluorescence was evaluated by cytofluorimeter. Data are shown by representative dot plots and mean ± SEM of % of cells in early (Q2) and late (Q3) apoptosis (n = 7). *p < 0.05 vs USCs-Ctr.
Fig. 3
Fig. 3. USCs-ATM-KO DNA damage repair and mitochondrial oxidative stress.
A Representative images and quantification of comet assay analysis (Magnification 20X; insets zoom 2.5X; scale bar = 100 µm). USCs-Ctr and USCs-ATM-KO were stimulated with UVB 40 mJ/cm2 and, after 6 h of recovery, stained with PI and separated by electrophoresis. Data are expressed as mean ± SEM of % tail DNA of at least 176 cells in 3 independent experiments. *p < 0.05 vs UVB-stimulated USCs-Ctr. B Representative confocal images (40X magnification objective; scale bar = 30 µm) and fluorescence quantification of mitoSOX staining in USCs-Ctr and USCs-ATM-KO. The outline of the area of the cell is depicted in yellow, and that of the nuclei in white. Data are expressed as % of integrated density/cell area and are the mean ± SEM of 92 Ctr and 56 ATM-KO cells from 3 independent experiments.
Fig. 4
Fig. 4. USCs-ATM-KO display deregulated calcium homoeostasis.
A ATP-induced (100 μM) cytosolic Ca2+-release in USCs-Ctr and USCs-ATM-KO. Data are illustrated as representative traces as well as histograms (inset) of mean ± SEM of maximum peaks (ΔR/R0 Fura2) of 151 Ctr and 118 ATM-KO cells from 3 independent experiments. B ATP-induced (100 μM) mitochondrial Ca2+-signalling in USCs-Ctr and USCs-ATM-KO. Data are illustrated as representative traces as well as histograms (inset) of mean ± SEM of maximum peaks of maximum peaks (ΔR/R0 mt-fura-2.3) of 118 Ctr and 115 ATM-KO cells from 3 independent experiments. C Representative traces of Ca2+-release induced by TBHQ (50 μM) and subsequent SOCE. Histograms of mean ± SEM of maximum peaks following TBHQ stimulus and Ca2+ (2 mM) addition (ΔR/R0 Fura2) of 92 cells from 3 independent experiments. D Representative traces and histograms of mean ± SEM of maximum peaks of calcium analysis (basal calcium and ER calcium release) of cells (n = 40 cells) transfected with GAP3-ER Calcium indicator. E Representative Western blot and densitometric analysis of IP3R, GRP75, VDAC1-3 and MCU expression in USCs-Ctr and USCs-ATM-KO. Data are mean ± SEM (n = 4 independent experiments) of the % of the Ctr. **p < 0.01 USCs-ATM-KO vs USCs-Ctr; ***p < 0.001 USCs-ATM-KO vs USCs-Ctr; ****p < 0.0001 USCs-ATM-KO vs USCs-Ctr.
Fig. 5
Fig. 5. USC-SkMCs-ATM-KO characterization.
A Representative confocal images of ATM expression in USC-SkMCs-Ctr and ATM-KO (Magnification 63X; scale bar= 25 µm; Green: ATM; Red: Phalloidin; Blue: DAPI) and relative fluorescence quantification. Data are expressed as % of integrated density/cell area and are the mean ± SEM of 38 Ctr and 35 ATM-KO cells from 3 independent experiments. ****p < 0.0001 USCs-ATM-KO vs USCs-Ctr. B Representative phase-contrast images of USCs-Ctr and USCs-ATM-KO at different stages of differentiation towards SkMCs (d2, d14 and d28; magnification 200x). C qPCR analysis of skeletal muscle cell markers (myogenin, dystrophin, creatine kinase-CK, Mef2C, desmin, MyoD, Myf5). Data are mean ± SEM of at 15 independent experiments. *p < 0.05 and **p < 0.01 USC-SkMCs-ATM-KO vs Ctr (D) Representative confocal images of MyHC expression in USC-SkMCs-Ctr and ATM-KO (Magnification 40X; Red: MyHC; Blue: DAPI) and relative fluorescence quantification. Data are expressed as % of integrated density/cell area and are the mean ± SEM of 97 Ctr and 71 ATM-KO cells from 3 independent experiments.
Fig. 6
Fig. 6. USC-SkMCs-ATM-KO calcium homoeostasis.
A ATP-induced (100 μM) cytosolic Ca2+-release in USC-SkMCs-Ctr and ATM-KO. Data are illustrated as representative traces as well as histograms of mean ± SEM of maximum peaks (ΔR/R0 Fura2) of 180 Ctr and 119 ATM-KO cells from 3 independent experiments. B ATP-induced (100 μM) mitochondrial Ca2+-signalling in USC-SkMCs-Ctr and ATM-KO. Data are illustrated as representative traces as well as histograms of mean ± SEM of maximum peaks (ΔR/R0 mt-fura-2.3) of 97 Ctr and 111 ATM-KO cells from 3 independent experiments. C Representative traces Ca2+-release induced by TBHQ (50 μM) and subsequent SOCE. Histograms of mean ± SEM of maximum peaks following TBHQ stimulus and Ca2+ (2 mM) addition (ΔR/R0 Fura2) of 112 cells from 3 independent experiments. ****p < 0.0001 vs Ctr.
Fig. 7
Fig. 7. Calcium players expression in USC-SkMCs-ATM-KO.
Representative Western blots and densitometric analysis of A) PMCA, STIM1, Orai1 and B) GPR75, MCU, VDAC1-3 expression in skeletal muscle cells derived from both USCs-Ctr (SkMCs-Ctr) and ATM-KO (SkMCs-ATM-KO). Data are mean ± SEM (n = 4 independent experiments) of the % of the Ctr. *p < 0.05 and **p < 0.01 vs Ctr.
Fig. 8
Fig. 8. Collagen contraction assay.
USC-SkMCs were plated on collagen discs and treated with acetylcholine (100) μM. A The collagen area was measured at the indicated time points. Data are mean ± SEM of collagen area (cm2) at several time points (n = 3) *p < 0.05, **p < 0.01, ****p < 0.0001 USC-SkMCs-ATM-KO vs Ctr; °°p < 0.01, °°°°p < 0.0001 USC-SkMCs-ATM-KO + Ach vs Ctr + Ach. B Representative phase-contrast images of collagen discs at progressive time points. The arrow (pink for control and blue for the ATM-KO) indicates the reduction of the collagen area.

References

    1. Lee JH, Paull TT. Cellular functions of the protein kinase ATM and their relevance to human disease. Nat Rev Mol Cell Biol. 2021;22:796–814. - PubMed
    1. Amirifar P, Ranjouri MR, Lavin M, Abolhassani H, Yazdani R, Aghamohammadi A. Ataxia-telangiectasia: epidemiology, pathogenesis, clinical phenotype, diagnosis, prognosis and management. Expert Rev Clin Immunol. 2020;16:859–71. - PubMed
    1. Lavin MF. Ataxia-telangiectasia: from a rare disorder to a paradigm for cell signalling and cancer. Nat Rev Mol Cell Biol. 2008;9:759–69. - PubMed
    1. McKinnon PJ. ATM and the molecular pathogenesis of Ataxia Telangiectasia. Annu Rev Pathol Mech Dis. 2012;7:303–21. - PubMed
    1. Paull TT, Lee JH. The Mre11/Rad50/Nbs1 complex and its role as a DNA double-strand break sensor for ATM. Cell Cycle. 2005;4:737–40. - PubMed

LinkOut - more resources