. 2025 Apr 15;16(1):301.
doi: 10.1038/s41419-025-07606-z.

FTO controls CD8+ T cell survival and effector response by modulating m6A methylation of Fas

Affiliations

FTO controls CD8+ T cell survival and effector response by modulating m6A methylation of Fas

Lina Sun et al. Cell Death Dis. .

Abstract

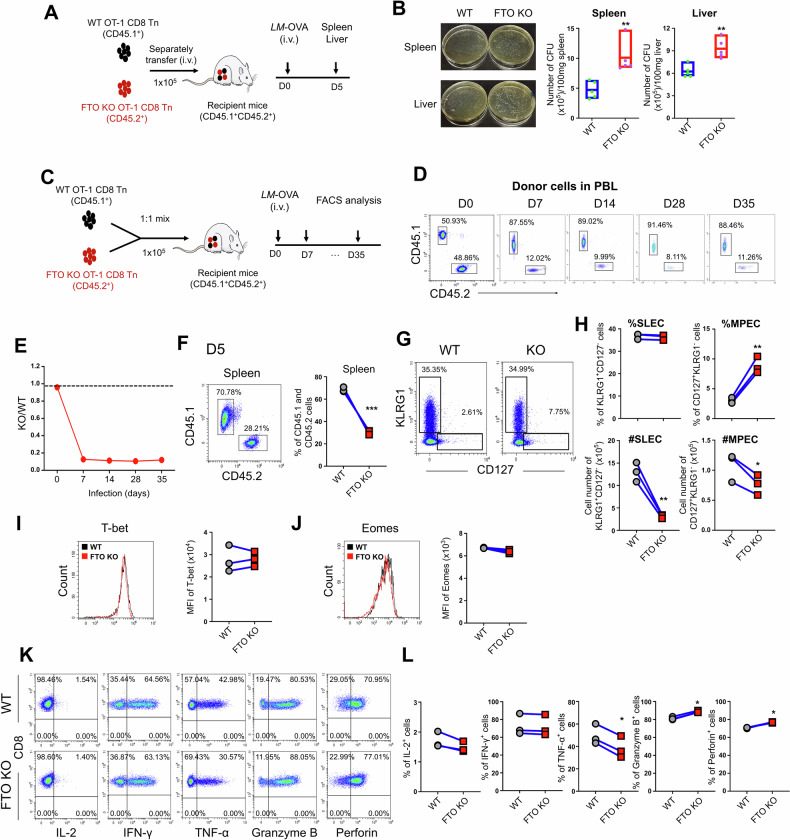
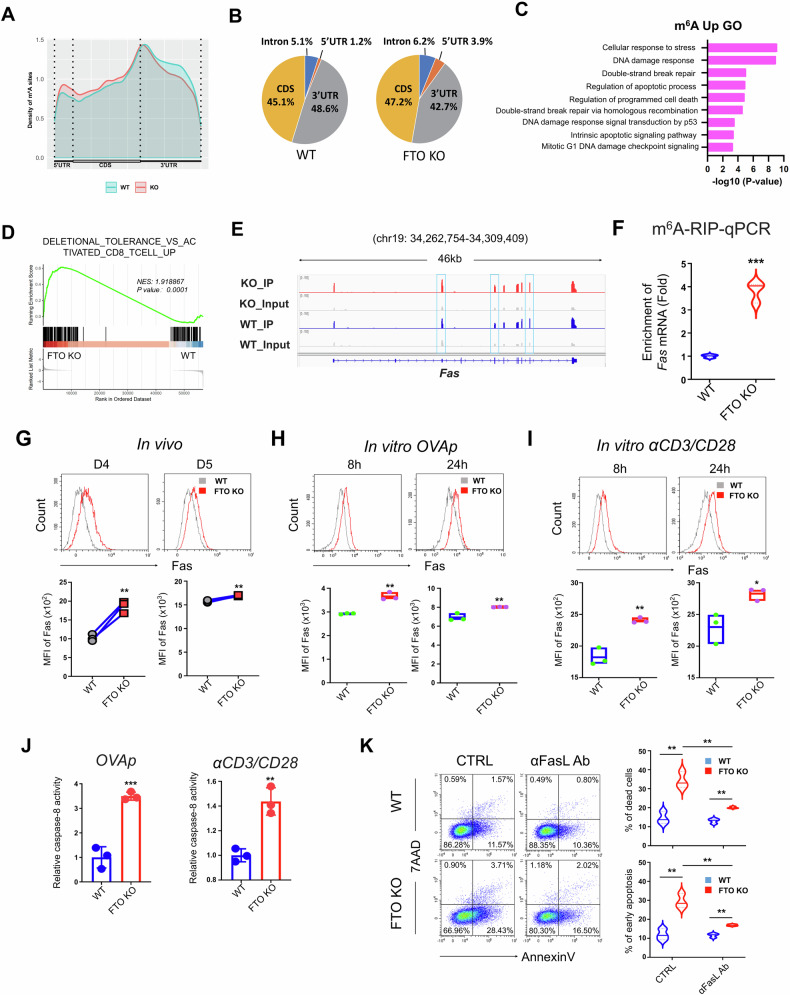
Functional CD8+ T cell immunity is essential for immune surveillance and host defense against infection and tumors. Epigenetic mechanisms, particularly RNA modification, in controlling CD8+ T cell immune response is not fully elucidated. Here, by T cell-specific deletion of fat mass and obesity-associated protein (FTO), a critical N6-methyladenosine (m6A) demethylase, we revealed that FTO was indispensable for adequate CD8+ T cell immune response and protective function. FTO ablation led to considerable cell death in activated CD8+ T cells, which was attributed to cell apoptosis. MeRIP-seq analysis revealed an increase in m6A methylation on Fas mRNA in FTO-deficient CD8+ T cells. The loss of FTO promoted Fas expression via enhancing the Fas mRNA stability, which depended on the m6A reader insulin-like growth factor-2 mRNA-biding proteins 3 (IGF2BP3). Mutation of the Fas m6A sites or knockdown IGF2BP3 could normalize the upregulated Fas expression and apoptosis levels caused by FTO ablation in CD8+ T cells. Our findings delineate a novel epigenetic regulatory mechanism of FTO-mediated m6A modification in supporting CD8+ T cell survival and effector responses, providing new insights into understanding the post-transcriptional regulation in CD8+ T cell immunological functions and the potential therapeutic intervention.


Conflict of interest statement

Competing interests: The authors declare no competing interests. Ethics approval and consent to participate: All methods used in this study were performed in accordance with the relevant guidelines and regulations. This study does not include human participants or human materials; therefore, obtaining informed consent for participation is not applicable. The animals used in this study were treated in accordance with the Institutional Animal Care and Use Committee of Xi’an Jiaotong University, Xi’an Center for Disease Control, and Suzhou Institute of Systems Medicine (XJTUAE2022-1160, XJTUAE2022-1161).

Figures

Fig. 1
Fig. 1. FTO is required for effector CD8+ T cell responses during acute infection.
A Experimental diagram of in vivo CD8+ T cell separate transfer assay to assess the bacterial clearance. Five days after infection, the bacterial loads were determined in the spleen and liver from mice received WT or FTO KO CD8+ T cells (n = 5). B Representative photos of agar plates showing the bacterial colony formation in the spleen and liver; numbers of bacterial colonies per 100 mg tissues. C Experimental schematic of CD8+ T cell co-transfer model. D Flow cytometry analysis of donor cells from WT (CD45.1+) or FTO KO (CD45.2+) groups in CD8+ T cells in peripheral blood lymphocytes (PBL) at different timepoints after LM-OVA infection (n = 7). E The ratio of percentages of KO to WT cells in the PBL at different timepoints. FL The proportions and phenotypes of donor-derived (OT-1+) CD8+ T cells from WT and KO groups were analyzed 5 days after LM-OVA infection in the spleen (n = 3). F Flow cytometry analysis of donor-derived (OT-1+) CD8+ T cells from WT (CD45.1+) and KO (CD45.2+) groups. G Representative flow cytometry plots of KLRG1 and CD127 expression in donor-derived (OT-1+) CD8+ T cells. H The proportion (%) and cell number (#) of KLRG1+CD127 SLECs and KLRG1CD127+ MPECs in donor-derived CD8+ T cells. Flow cytometry analysis of T-bet (I) and Eomes (J) expression in WT and FTO KO donor-derived (OT-1+) CD8+ T cells on day 5. Representative flow cytometry plots (K) and percentages (L) of WT and KO CD8+ T cells producing cytokines IL-2, IFN-γ, TNF-α, granzyme B, and perforin among donor-derived (OT-1+) cells on day 5. Data are representative of two or three independent experiments shown as the mean ± SD. Statistical testing is depicted as two-sided, unpaired t-tests; *P ≤ 0.05, **P ≤ 0.01, ***P ≤ 0.001.
Fig. 2
Fig. 2. FTO deficiency affects effector CD8+ T cell survival.
A, B Flow cytometry analysis of Ki67 expression in WT and FTO KO donor-derived (OT-1+) CD8+ T cells in the spleen from recipient mice 4 (left) and 5 (right) days post LM-OVA infection in the in vivo co-transfer model in Fig. 1C (n = 3). C, D Flow cytometry analysis of Ki67 expression and BrdU incorporation in WT (Ftofl/flCD4-CreOT-1+) and FTO KO (Ftofl/flCD4-Cre+OT-1+) CD8+ T cells stimulated in vitro with OVA257-264 peptide for 48 h (n = 3). E Flow cytometry analysis of Annexin V and 7AAD expression in WT and FTO KO donor-derived (OT-1+) CD8+ T cells in the spleen from recipient mice 4 (up) or 5 (bottom) days post LM-OVA infection in the in vivo co-transfer model (n = 3). F The frequencies of total dead (Annexin V+ and 7AAD+) cells in WT and FTO KO donor-derived (OT-1+) CD8+ T cells 4 (up) or 5 (bottom) days post-infection. G The frequencies of early (Annexin V+7AAD) and late (Annexin V+7AAD+) apoptotic cells and necroptotic (Annexin V7AAD+) cells in WT and FTO KO donor-derived (OT-1+) CD8+ T cells 4 (up) or 5 (bottom) days post-infection. H, I Representative flow cytometry plots and the frequencies of Annexin V and 7AAD expression in WT and FTO KO CD8+ T cells upon stimulation. H Splenocytes from WT (Ftofl/flCD4-CreOT-1+) and FTO KO (Ftofl/flCD4-Cre+OT-1+) mice were isolated and stimulated in vitro with OVA257-264 peptide for 24 h or 48 h to measure Annexin V and 7AAD expression in CD8+ T cells (n = 3). I Splenocytes from WT (Ftofl/flCD4-Cre) and FTO KO (Ftofl/flCD4-Cre+) mice were isolated and stimulated in vitro with anti-CD3/CD28 antibodies for 24 h or 48 h to measure Annexin V and 7AAD expression in CD8+ T cells (n = 4). Percentages of total dead and early apoptotic cells were shown in (H, I). Data are representative of two or three independent experiments shown as the mean ± SD. Statistical testing is depicted as two-sided, unpaired t-tests; *P ≤ 0.05, **P ≤ 0.01, ***P ≤ 0.001.
Fig. 3
Fig. 3. FTO-deficient effector CD8+ T cells have increased cell apoptosis.
A Splenocytes from WT (Ftofl/flCD4-Cre) and FTO KO (Ftofl/flCD4-Cre+) mice were stimulated with anti-CD3/CD28 antibodies for 24 h in the presence of Z-VAD to measure Annexin V and 7AAD expression in CD8+ T cells (n = 3). B GO analysis of DEGs from RNA-seq data depicting the upregulated and downregulated signaling pathways in FTO KO CD8+ T cells compared to WT control. C Hallmark gene sets associated signaling pathways were enriched in FTO KO CD8+ T cells. D Representative flow cytometry plots and the mean fluorescence intensity (MFI) of Bcl-2 expression in WT and FTO KO donor-derived (OT-1+) CD8+ T cells in the spleen from recipient mice 4 (up) or 5 (bottom) days post LM-OVA infection in the in vivo co-transfer model (n = 3). E Representative flow cytometry plots and the MFI of activated (cleaved) caspase-3 expression in the WT (Ftofl/flCD4-CreOT-1+) and FTO KO (Ftofl/flCD4-Cre+OT-1+) CD8+ T cells stimulated in vitro with OVA257-264 peptide (left) for 24 h (n = 3). F Representative flow cytometry plots and the MFI of activated (cleaved) caspase-3 expression in the WT (Ftofl/flCD4-Cre) and FTO KO (Ftofl/flCD4-Cre+) CD8+ T cells stimulated in vitro with anti-CD3/CD28 antibodies for 24 h (n = 3). G The protein levels of Bcl-2 and cleaved caspase-3 were measured by Western blot in WT (Ftofl/flCD4-Cre) and FTO KO (Ftofl/flCD4-Cre+) CD8+ T cells stimulated in vitro with anti-CD3/CD28 antibodies for 48 h. Data are representative of two or three independent experiments shown as the mean ± SD. Statistical testing is depicted as two-sided, unpaired t-tests or two-way ANOVA; *P ≤ 0.05, **P ≤ 0.01, ***P ≤ 0.001.
Fig. 4
Fig. 4. FTO regulates CD8+ T cell survival via m6A modification on Fas.
A The metagene profile of m6A sites distributed across a normalized transcript segment containing three regions: 5′ UTR, CDS, and 3′ UTR in WT and FTO KO CD8+ T cells. B Pie charts showing the percentages of total m6A modifications distributed in 5′ UTR, CDS, intron, and 3′ UTR regions of WT and FTO KO CD8+ T cells. C GO analysis of enriched pathways using m6A upregulated genes in FTO KO CD8+ T cells compared to WT control. D GSEA plot depicting the enriched pathway in FTO KO CD8+ T cells using C7 immunologic gene sets. E Integrative Genomics Viewer (IGV) tracks displaying the m6A modification sites on Fas mRNA based on MeRIP-Seq data in WT and FTO KO CD8+ T cells. The upregulated m6A modification sites with high confidence were marked in cyan squares. F The m6A enrichment of Fas mRNA in WT and FTO KO CD8+ T cells was measured by m6A-RIP-qPCR analysis (n = 3). G Representative flow cytometry plots and the MFI of Fas expression on the WT and FTO KO donor-derived (OT-1+) CD8+ T cells in the spleen from recipient mice 4 (left) and 5 (right) days post LM-OVA infection in the in vivo co-transfer model (n = 3). H Representative flow cytometry plots and the MFI of Fas expression on the WT (Ftofl/flCD4-CreOT-1+) and FTO KO (Ftofl/flCD4-Cre+OT-1+) CD8+ T cells stimulated in vitro with OVA257-264 peptide for 8 h (left) and 24 h (right) (n = 3). I Representative flow cytometry plots and the MFI of Fas expression on the WT (Ftofl/flCD4-Cre) and FTO KO (Ftofl/flCD4-Cre+) CD8+ T cells stimulated in vitro with anti-CD3/CD28 antibodies for 8 h (left) and 24 h (right) (n = 3). J Caspase-8 activity in WT and FTO KO CD8+ T cells stimulated in vitro with OVA257-264 peptide (left, OT-1+CD8+ T cells) and anti-CD3/CD28 antibodies (right, WT CD8+ T cells) for 24 h (n = 3). K Flow cytometry analysis of Annexin V and 7AAD expression on WT (Ftofl/flCD4-Cre) and FTO KO (Ftofl/flCD4-Cre+) CD8+ T cells stimulated in vitro with anti-CD3/CD28 antibodies in the presence or absence of anti-FasL blocking antibodies for 24 h (n = 3). Data are representative of two or three independent experiments shown as the mean ± SD. Statistical testing is depicted as two-sided, unpaired t-tests or two-way ANOVA; *P ≤ 0.05, **P ≤ 0.01, ***P ≤ 0.001.
Fig. 5
Fig. 5. FTO deficiency enhances Fas mRNA stability in CD8+ T cells.
A The mRNA expression of Fas in WT (Ftofl/flCD4-Cre) and FTO KO (Ftofl/flCD4-Cre+) CD8+ T cells stimulated in vitro with anti-CD3/CD28 antibodies at indicated timepoints was measured by qPCR (n = 3). B mRNA decay assay showing the remaining content of Fas mRNA measured by qPCR in WT and FTO KO CD8+ T cells with ActD treatment. The remaining mRNAs were normalized to 0 h (n = 3). C The mRNA levels of Fas in (B) at different timepoints after ActD treatment (n = 3). DF WT and FTO KO CD8+ T cells were stimulated with anti-CD3/CD28 antibodies for 12 h before adding in CHX treatment at different timepoints (n = 3). The representative flow cytometry plots (D) and MFI (E) of Fas expression on WT and FTO KO CD8+ T cells. CHX administration was marked with the arrow at 0 h, and naïve cells were indicated as −12 h. F The Fas expression on WT and FTO KO CD8+ T cells after CHX treatment was normalized to 0 h. GI WT and FTO KO CD8+ T cells were stimulated with anti-CD3/CD28 antibodies for 4 h before adding in MG132 treatment at different timepoints (n = 3). The representative flow cytometry plots (G) and MFI (H) of Fas expression on WT and FTO KO CD8+ T cells. MG132 administration was marked with the arrow at 0 h, and naïve cells were indicated as −4 h. I The Fas expression on WT and FTO KO CD8+ T cells after MG132 treatment was normalized to 0 h. Data are representative of two or three independent experiments shown as the mean ± SD. Statistical testing is depicted as two-sided, unpaired t-tests; *P ≤ 0.05, **P ≤ 0.01, ***P ≤ 0.001.
Fig. 6
Fig. 6. Loss of FTO enhances the IGF2BP3-mediated transcription of Fas.
A Schematic representation of plasmid constructs with WT and m6A site mutations on Fas mRNA (mut 1: mutations on both site 1 and site 2; mut 2: mutation on site 3; mut 3: mutation on site 4). B Representative flow cytometry plots showing Fas expression and Annexin V/7AAD expression on WT (Ftofl/flCD4-Cre) and FTO KO (Ftofl/flCD4-Cre+) CD8+ T cells overexpressed (OE) with Mock, Fas WT or mutant plasmids followed by stimulation with anti-CD3/CD28 antibodies for 24 h (for Fas detection) and 48 h (for Annexin V/7AAD detection) (n = 3). C Fas expression levels, frequencies of total dead cells, and early apoptotic cells were shown in different groups of CD8+ T cells from (B). n.s. means not significant. D Representative flow cytometry plots showing Fas expression and Annexin V/7AAD expression on WT (Ftofl/flCD4-Cre) and FTO KO (Ftofl/flCD4-Cre+) CD8+ T cells transfected with either Mock or Igf2bp3 shRNA followed by stimulation with anti-CD3/CD28 antibodies for 24 h (for Fas detection) and 48 h (for Annexin V/7AAD detection) (n = 3). E Fas expression levels, frequencies of total dead cells, and early apoptotic cells were shown in different groups of CD8+ T cells from (D). Data are representative of two or three independent experiments shown as the mean ± SD. Statistical testing is depicted as two-sided, unpaired t-tests or one-way ANOVA; *P ≤ 0.05, **P ≤ 0.01, ***P ≤ 0.001.
Fig. 7
Fig. 7. Mechanistic scheme showing the FTO-mediated m6A methylation of Fas in regulating CD8+ T cell survival and effector response.
In WT CD8+ T cells, the presence of FTO effectively demethylates m6A modification on Fas mRNA, which leads to appropriate Fas expression and cell survival upon antigen stimulation. Compared to WT cells, FTO-deficient CD8+ T cells exhibit elevated m6A modification on Fas mRNA, which promotes its mRNA stability dependent on m6A reader protein IGF2BP3, resulting in subsequent increases of Fas expression and cell apoptosis upon cell activation.

References

    1. Kaech SM, Wherry EJ. Heterogeneity and cell-fate decisions in effector and memory CD8+ T cell differentiation during viral infection. Immunity. 2007;27:393–405. - PMC - PubMed
    1. Sun LA, Su YH, Jiao AJ, Wang X, Zhang BJ. T cells in health and disease. Signal Transduct Tar. 2023;8:235. - PMC - PubMed
    1. Chung HK, McDonald B, Kaech SM. The architectural design of CD8 T cell responses in acute and chronic infection: Parallel structures with divergent fates. J Exp Med. 2021;218:e20201730. - PMC - PubMed
    1. Henning AN, Roychoudhuri R, Restifo NP. Epigenetic control of CD8(+) T cell differentiation. Nat Rev Immunol. 2018;18:340–56. - PMC - PubMed
    1. Chen Y, Zander R, Khatun A, Schauder DM, Cui W. Transcriptional and Epigenetic Regulation of Effector and Memory CD8 T Cell Differentiation. Front Immunol. 2018;9:2826. - PMC - PubMed

LinkOut - more resources