. 2025 Apr 15;16(1):3569.
doi: 10.1038/s41467-025-58760-z.

Engineering intercellular communication using M13 phagemid and CRISPR-based gene regulation for multicellular computing in Escherichia coli

Affiliations

Engineering intercellular communication using M13 phagemid and CRISPR-based gene regulation for multicellular computing in Escherichia coli

Hadiastri Kusumawardhani et al. Nat Commun. .

Abstract

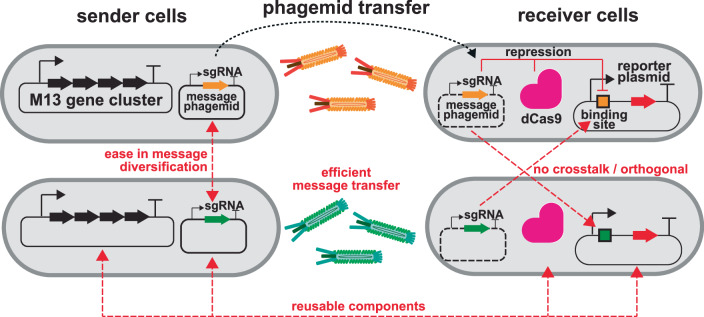
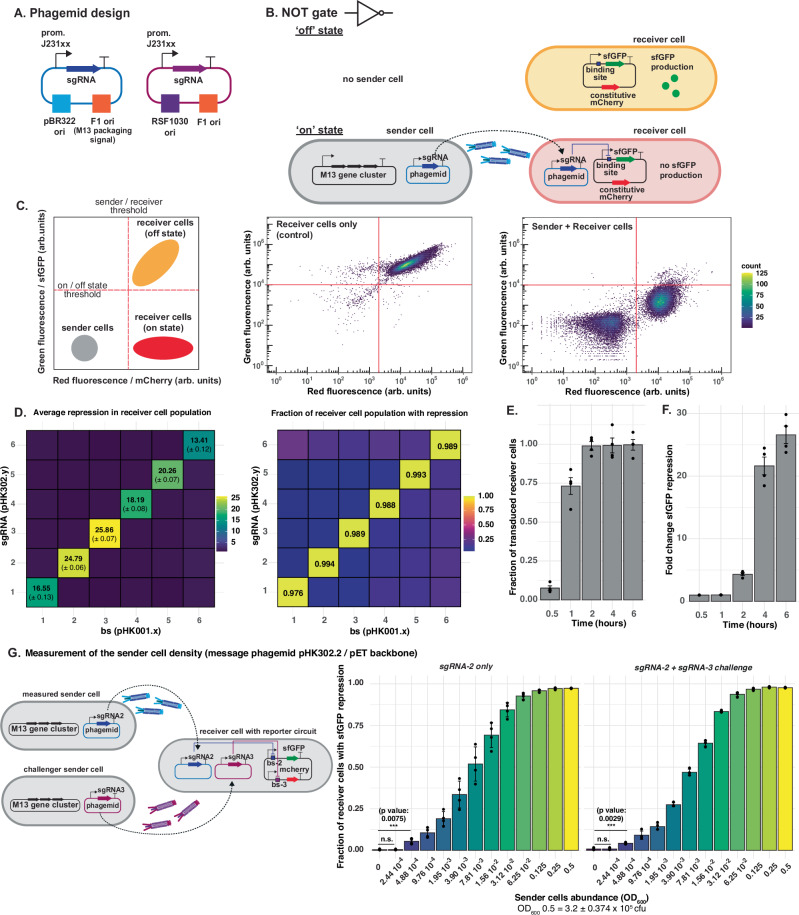
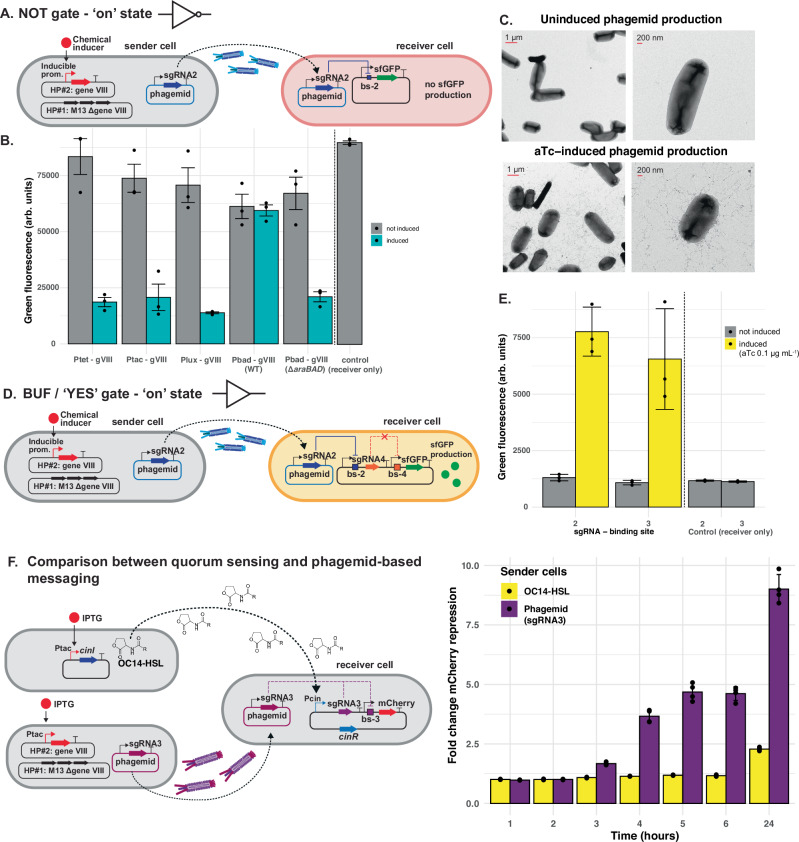
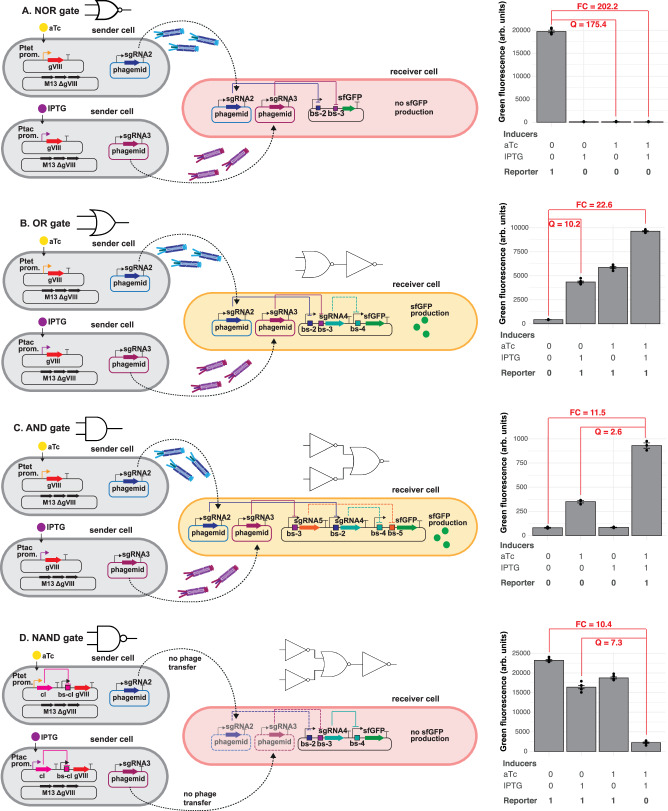
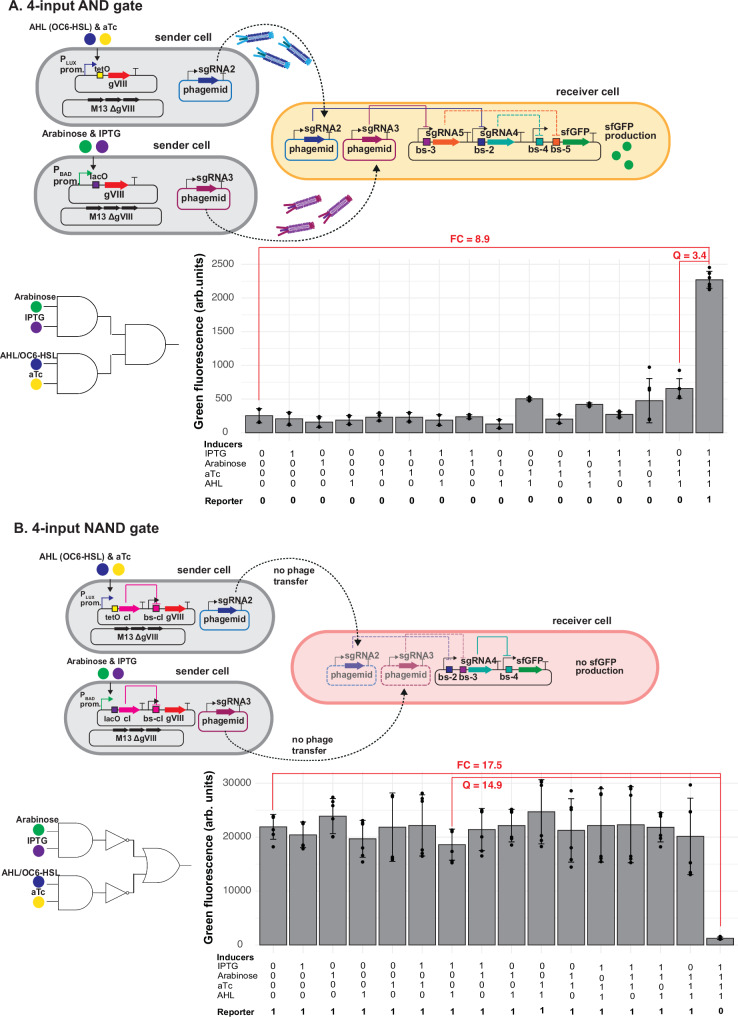
Engineering multicellular consortia, where information processing is distributed across specialized cell types, offers a promising strategy for implementing sophisticated biocomputing systems. However, a major challenge remains in establishing orthogonal intercellular communication, or "wires," within synthetic bacterial consortia. In this study, we address this bottleneck by integrating phagemid-mediated intercellular communication with CRISPR-based gene regulation for multicellular computing in synthetic E. coli consortia. We achieve intercellular communication with high sensitivity by regulating the transfer of single guide RNAs (sgRNAs) encoded on M13 phagemids from sender to receiver cells. Once inside the receiver cells, the transferred sgRNAs mediate gene regulation via CRISPR interference. Leveraging this approach, we successfully constructed one-, two-, and four-input logic gates. Our work expands the toolkit for intercellular communication and paves the way for complex information processing in synthetic microbial consortia, with diverse potential applications, including biocomputing, biosensing, and biomanufacturing.


Conflict of interest statement

Competing interests: The authors declare no competing interests.

Figures

Fig. 1
Fig. 1. Design of intercellular communication using M13 phage and CRISPR-based gene regulation.
Intercellular communication is achieved through the exchange of genetic material between sender and receiver cells mediated by M13 phage transfer. M13 phage particles contain a plasmid with a M13 packaging signal (phagemid) that encodes the DNA message, in this case a single guide RNA. This communication system allows for reusable components, ease in message diversification (i.e., exchanging sgRNA with another DNA message), efficient message transfer (>97% transfer within 4 h of co-culturing sender and receiver cells), and orthogonality between different sgRNA messages.
Fig. 2
Fig. 2. Characterization of phagemid transfer.
A Schematic representations of the two types of phagemids. B An inverter/‘NOT’ gate design with constitutive phagemid transfer between sender and receiver cells. The phagemid coding for a sgRNA is packaged into M13 phage particles by sender cells and transduced to receiver cells. Together with dCas9 (not shown) in the receiver cells sgRNA inhibits reporter expression. C Measurement of phagemid transfer between sender and receiver cells with flow cytometry. Schematic of where sender and receiver cells are expected in a flow cytometry plot where sfGFP expression is plotted against mCherry fluorescence (left). Flow cytometry measurement of sfGFP and mCherry reporters of receiver cells only (middle) or upon co-culturing sender and receiver cells at 37 °C for 4 h (right). D Orthogonality assay of different sgRNAs in sender pBR322-based phagemids (pHK302.y, ampicillin resistance) (y axis) and binding sites in receiver cells (pHK001.x) (x axis). The initial sender-to-receiver ratio was 1:1. Left: Mean ± SD of 3 independent biological replicate of sfGFP repression fold-change determined by flow cytometry. Right: fraction of receiver cells with fluorescent below the chosen threshold (shown in C). Data represent the mean of 3 independent biological replicates. E Transduction of pBR322-based message phagemid (with gentamicin resistance) over time determined by calculating colony-forming units of successfully transduced cells using selective plating divided by total amount of receiver colonies. The initial sender-to-receiver ratio was 2:1. Corresponding data of pBR322 with ampicillin resistance and for the RSF1030 backbone can be found in Fig. S1. F Fold-change of sfGFP reporter repression over time for pBR322-based phagemid. Data in E and F represent the mean ± SD of 4 independent biological replicates. G Measurement of the sender cell density using pET/pBR322-based phagemids. Receiver cells harbored two independent NOT gates allowing the detection of two distinct sender cell populations independently. The sensitivity of this circuit was tested by co-culturing receiver cells at OD600 0.5 (3.2 ± 0.375 × 105 cfu) with only sender cells sending sgRNA-2 at different densities or challenged by an additional sender cell population at OD600 0.5 sending sgRNA-3. Data in G represent the mean ± SD of 4 independent biological replicates. Student’s t-test was performed to determine statistical significance between the samples with and without sender cells added. Source data are provided as a Source Data file.
Fig. 3
Fig. 3. Establishing inducible phagemid transfer in one-input logic gates.
A Schematic representation of sender and receiver cells for an inducible NOT gate. Gene VIII (gVIII) was deleted on helper plasmid (HP) #1 and added to HP#2 under the control of an inducible promoter B Performance of different inducible promoters regulating P8 production. Green fluorescence (arbitrary units, arb. units) of the receiver cells was measured after 4 h of co-culturing with inducible sender cells with the indicated promoters controlling expression of gVIII in the presence (green) or absence (grey) of the corresponding inducer: aTc (0.1 mg liter−1), IPTG (1 mM), AHL (10 mM) and arabinose (1%). The initial sender-to-receiver ratio was 3:1. Data represent the mean ± SD of 3 independent biological replicates. WT wild-type (strain JM101), ΔaraBAD: strain JM101 with genes araBAD deleted. C TEM images of sender cells in the presence or absence of 1 mg liter−1aTc inducer, grown for 4 h at 37 °C with 1000 rpm shaking. D Schematic representation of one version of an inducible BUF/‘Yes’ gate. E Performance of two BUF gate variants using inducible phagemid sender cells. Green fluorescence (a. u.) of the receiver cells was measured after 4 h of co-culturing with inducible sender cells (aTc-inducible) for BUF gates with sgRNA-2 transduced (as indicated in D). A second variant was tested in which sgRNA-3 is transduced and sgRNA-5 represses sfGFP. The initial sender-to-receiver ratio was 3:1. Data represent the mean ± SD of 3 independent biological replicates. F Comparison of phagemid-based to quorum-sensing-based intercellular communication in liquid culture. Receiver cells contained a mCherry reporter that can be repressed by sgRNA-3. This sgRNA-3 is produced if the receiver cells sense OC14-HSL or if they receive a message phagemid containing sgRNA-3. The inducible phagemid sender cells contained Ptac-regulated gVIII, whereas the quorum-sensing sender cells contained Ptac-regulated cinI for OC14-HSL production. Red fluorescence (arb. units) of the receiver cells was monitored at 1, 2, 3, 4, 5, 6, and 24 h of co-culturing (sender-to-receiver ratio 3:1) with inducible sender cells (IPTG-inducible phagemid transfer or OC14-HSL production). mCherry-fold repressions were calculated from these measurements. Data represent the mean ± SD of 4 independent biological replicates. Source data are provided as a Source Data file.
Fig. 4
Fig. 4. Two-input Boolean logic gates in multicellular consortia.
A 2-input NOR gate. Left: A schematic representation of an inducible NOR gate design. Right: Average of green fluorescence (arb. units) measured by flow cytometry in the presence or absence of 0.1 mg liter−1 aTc and 1 mM IPTG inducers. Data represents the mean ± SD of 5 independent biological replicates. B 2-input OR gate. Left: A schematic representation of an inducible ‘OR’ gate design. Right: Average of green fluorescence (arb. units) measured by flow cytometry in the presence or absence of 0.1 mg liter−1 aTc and 1 mM IPTG inducers. Data represents the mean +/- SD of 6 independent biological replicates. C 2-input AND gate. Left: A schematic representation of an inducible ‘AND’ gate design. Right: Average of green fluorescence (arb. units) measured by flow cytometry in the presence or absence of 0.025 mg liter−1 aTc and 0.25 mM IPTG inducers. Data represents the mean ± SD of 3 independent biological replicates and error bars represents standard deviation. D 2-input NAND gate. Left: A schematic representation of an inducible ‘NAND’ gate design. Right: Average of green fluorescence (arb. units) measured by flow cytometry in the presence or absence of 0.1 mg liter−1 aTc and 1 mM IPTG inducers. Data represents the mean ± SD of 6 independent biological replicates. For all 2-input gates, the initial sender-to-receiver ratio was 3:1. Fold-change (FC) is calculated by dividing the ‘ON’ state by the ‘OFF’ state, while the quality score (Q) was calculated by dividing the lowest ‘ON’ state by the highest ‘OFF’ state. Source data are provided as a Source Data file.
Fig. 5
Fig. 5. Four-input Boolean logic gates design.
A 4-input AND gate. Top: 4-input ‘AND’ gate design: a combination of two-input ‘AND’ gates in sender cells and a two-input ‘AND’ gate in receiver cells. Bottom: Mean of green fluorescence (arb. units) ± SD of 6 independent replicates, measured by flow cytometry in the presence or absence of 1 mM IPTG, 1 % arabinose, 0.1 mg liter−1 aTc and 1 mM AHL inducers. B 4-input NAND gate. Top: 4-input ‘AND’ gate design: a combination of two-input ‘AND’ gates in sender cells, two inverters and a two-input ‘OR’ gate in receiver cells. Bottom: Mean of green fluorescence (arb. units) ± SD of 6 independent replicates, measured by flow cytometry in the presence or absence of 1 mM IPTG, 1 % arabinose, 0.1 mg liter−1 aTc and 1 mM AHL inducers. For both 4-input gates, the initial sender to receiver ratio was 3:1. Fold-change (FC) is calculated by dividing the ‘ON’ state by the ‘OFF’ state, while the quality score (Q) was calculated by dividing the lowest ‘ON’ state by the highest ‘OFF’ state. Source data are provided as a Source Data file.

Similar articles

References

    1. Voigt, C. A. Synthetic biology 2020–2030: six commercially-available products that are changing our world. Nat. Commun.11, 6379 (2020). - PMC - PubMed
    1. Cubillos-Ruiz, A. et al. Engineering living therapeutics with synthetic biology. Nat. Rev. Drug Discov.20, 941–960 (2021). - PubMed
    1. Wurtzel, E. T. et al. Revolutionizing agriculture with synthetic biology. Nat. Plants5, 1207–1210 (2019). - PubMed
    1. Clarke, L. & Kitney, R. Developing synthetic biology for industrial biotechnology applications. Biochem. Soc. Trans.48, 113–122 (2020). - PMC - PubMed
    1. Siuti, P., Yazbek, J. & Lu, T. K. Synthetic circuits integrating logic and memory in living cells. Nat. Biotechnol.31, 448–452 (2013). - PubMed

MeSH terms

Substances

LinkOut - more resources