

C-type natriuretic peptide regulates lipid metabolism through a NPRB-PPAR pathway in the intramuscular and subcutaneous adipocytes in chickens
- PMID: 40234429
- PMCID: PMC12000514
- DOI: 10.1038/s41598-025-86433-w
C-type natriuretic peptide regulates lipid metabolism through a NPRB-PPAR pathway in the intramuscular and subcutaneous adipocytes in chickens
Abstract
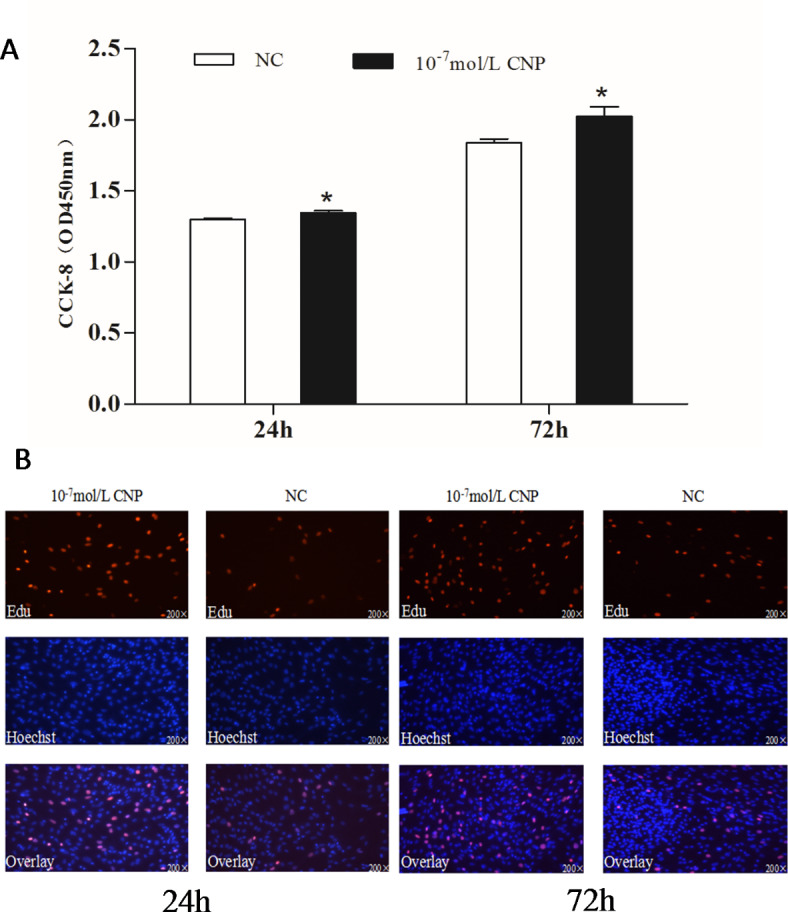
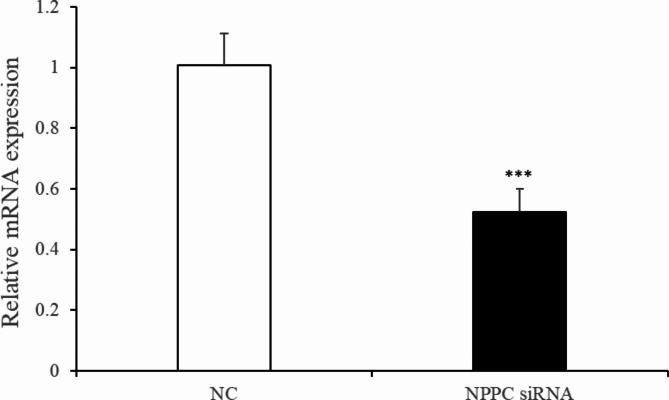
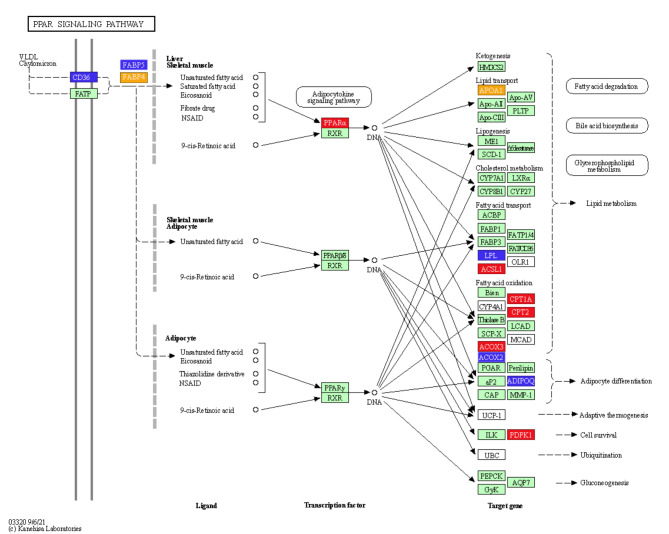
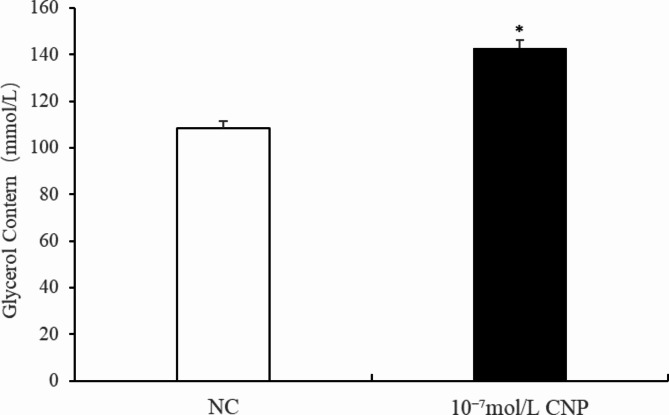
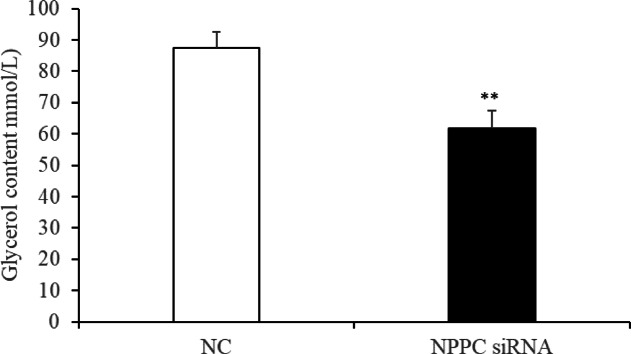
Natriuretic peptides (NPs) have an important role in lipid metabolism in skeletal muscle and adipose tissue in animals. C-type natriuretic peptide (CNP) is an important NP, but the molecular mechanisms that underlie its activity are not completely understood. Treatment of intramuscular fat (IMF) and subcutaneous fat (SCF) adipocytes with CNP led to decreased differentiation, promoted proliferation and lipolysis, and increased the expression of natriuretic peptide receptor B (NPRB) mRNA. Silencing natriuretic peptide C (NPPC) had the opposite results in IMF and SCF adipocytes. Transcriptome analysis found 665 differentially expressed genes (DEGs) in IMF adipocytes and 991 in SCF adipocytes. Seven genes in IMF adipocytes (FABP4, APOA1, ACOX2, ADIPOQ, CD36, FABP5, and LPL) and eight genes in SCF adipocytes (ACOX3, ACSL1, APOA1, CPT1A, CPT2, FABP4, PDPK1 and PPARα) are related to fat metabolism. Fifteen genes were found to be enriched in the peroxisome proliferator-activated receptor (PPAR) pathway. Integrated analysis identified 113 intersection genes in IMF and SCF adipocytes, two of which (APOA1 and FABP4) were enriched in the PPAR pathway. In conclusion, CNP may regulated lipid metabolism through the NPRB-PPAR pathway in both IMF and SCF adipocytes, FABP4 and APOA1 may be the key genes that mediated CNP regulation of fat deposition.
Keywords: C-type natriuretic peptide; Intramuscular adipocytes; PPAR pathway; Subcutaneous adipocytes.
© 2025. The Author(s).
Conflict of interest statement
Declarations. Ethics approval and consent to participate: The study was conducted following the Guidelines for Experimental Animals formulated by the Ministry of Science and Technology (Beijing, China). All experimental procedures were approved by the Science Research Department (in charge of animal welfare) of the Institute of Poultry Science, Chinese Academy of Agricultural Sciences (Jiangsu, China). All methods were carried out following the relevant guidelines and regulations. Also, all methods were reported following the ARRIVE guidelines. Competing interests: The authors declare no competing interests.
Figures


Similar articles
-
LKB1 Differently Regulates Adipogenesis in Intramuscular and Subcutaneous Adipocytes through Metabolic and Cytokine-Related Signaling Pathways.Cells. 2020 Dec 4;9(12):2599. doi: 10.3390/cells9122599. Cells. 2020. PMID: 33291665 Free PMC article.
-
Identification of differentially expressed genes and pathways between intramuscular and abdominal fat-derived preadipocyte differentiation of chickens in vitro.BMC Genomics. 2019 Oct 15;20(1):743. doi: 10.1186/s12864-019-6116-0. BMC Genomics. 2019. PMID: 31615399 Free PMC article.
-
Transcriptional insights into key genes and pathways controlling muscle lipid metabolism in broiler chickens.BMC Genomics. 2019 Nov 15;20(1):863. doi: 10.1186/s12864-019-6221-0. BMC Genomics. 2019. PMID: 31729950 Free PMC article.
-
Adipocyte-specific expression of C-type natriuretic peptide suppresses lipid metabolism and adipocyte hypertrophy in adipose tissues in mice fed high-fat diet.Sci Rep. 2018 Feb 1;8(1):2093. doi: 10.1038/s41598-018-20469-z. Sci Rep. 2018. PMID: 29391544 Free PMC article.
-
Role of the natriuretic peptide system in lipogenesis/lipolysis.Nutr Metab Cardiovasc Dis. 2003 Aug;13(4):244-9. doi: 10.1016/s0939-4753(03)80018-2. Nutr Metab Cardiovasc Dis. 2003. PMID: 14650358 Review.
Cited by
-
Research advances in intramuscular fat deposition and chicken meat quality: genetics and nutrition.J Anim Sci Biotechnol. 2025 Jul 16;16(1):100. doi: 10.1186/s40104-025-01234-5. J Anim Sci Biotechnol. 2025. PMID: 40665461 Free PMC article. Review.
-
A β-cyclodextrin/AuNPs@MWCNT/chitosan-hydrogel-based 3D stochastic sensor for simultaneous determination of vascular cell adhesion molecule-1, interleukin-6, and natriuretic peptide C-type in whole blood samples.Mikrochim Acta. 2025 Sep 5;192(10):637. doi: 10.1007/s00604-025-07514-1. Mikrochim Acta. 2025. PMID: 40913200
References
-
- Hocquette, J. F. et al. Intramuscular fat content in meat-producing animals: development, genetic and nutritional control, and identification of putative markers. J. Animal:An Int. J. Anim. Bioscience, 4(2): 303 – 19(2010). - PubMed
-
- Kawai, M. et al. Growth hormone stimulates adipogenesis of 3T3-L1 cells through activation of the Stat5A/5B-PPARgamma pathway. J. Mol. Endocrinol.38 (1–2), 19–34 (2007). - PubMed
MeSH terms
Substances
Grants and funding
- CARS-42-Z05/China Agriculture Research System of MOF and MARA
- CARS-42-Z05/China Agriculture Research System of MOF and MARA
- CARS-42-Z05/China Agriculture Research System of MOF and MARA
- CARS-42-Z05/China Agriculture Research System of MOF and MARA
- CARS-42-Z05/China Agriculture Research System of MOF and MARA
- CARS-42-Z05/China Agriculture Research System of MOF and MARA
- CARS-42-Z05/China Agriculture Research System of MOF and MARA
- CARS-42-Z05/China Agriculture Research System of MOF and MARA
- 2021YFD1200803/National Key Research and Development Program of China
- 2021YFD1200803/National Key Research and Development Program of China
- 2021YFD1200803/National Key Research and Development Program of China
- 2021YFD1200803/National Key Research and Development Program of China
- 2021YFD1200803/National Key Research and Development Program of China
- 2021YFD1200803/National Key Research and Development Program of China
- 2021YFD1200803/National Key Research and Development Program of China
- 2021YFD1200803/National Key Research and Development Program of China
LinkOut - more resources
Full Text Sources
Research Materials
Miscellaneous
