. 2025 Apr 15;15(1):13007.
doi: 10.1038/s41598-025-96877-9.

LOXHD1 is an oncofusion-regulated antigen of ewing sarcoma

Affiliations

LOXHD1 is an oncofusion-regulated antigen of ewing sarcoma

Tatiana Blanchard et al. Sci Rep. .

Abstract

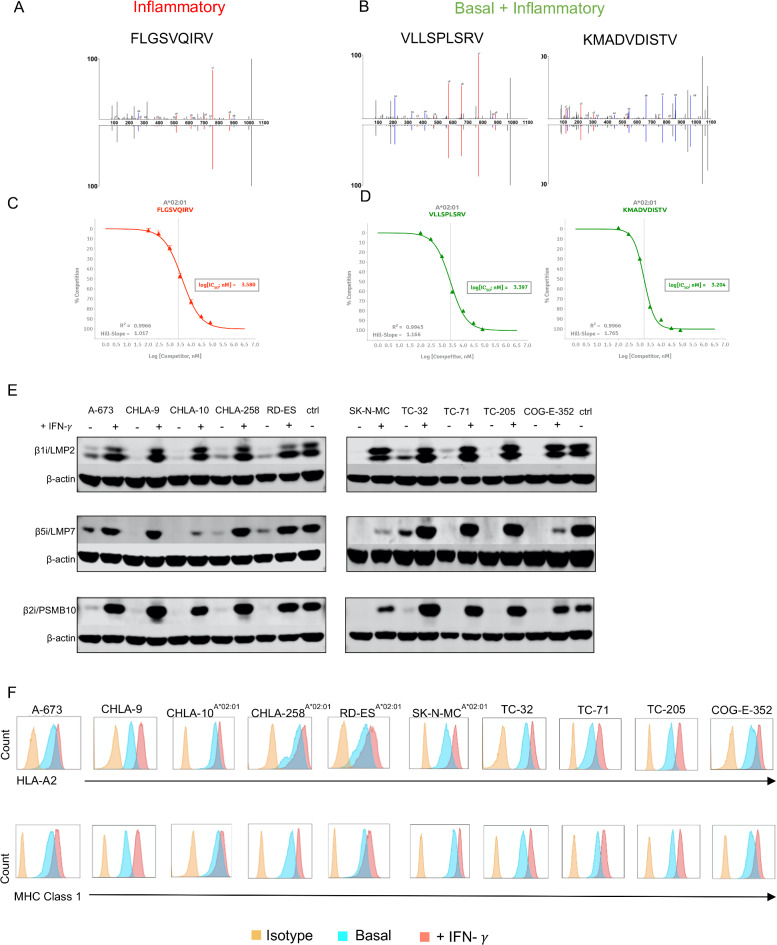
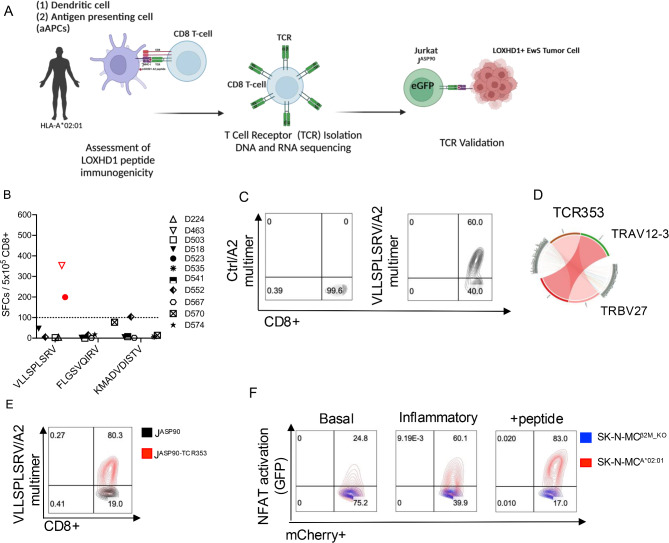
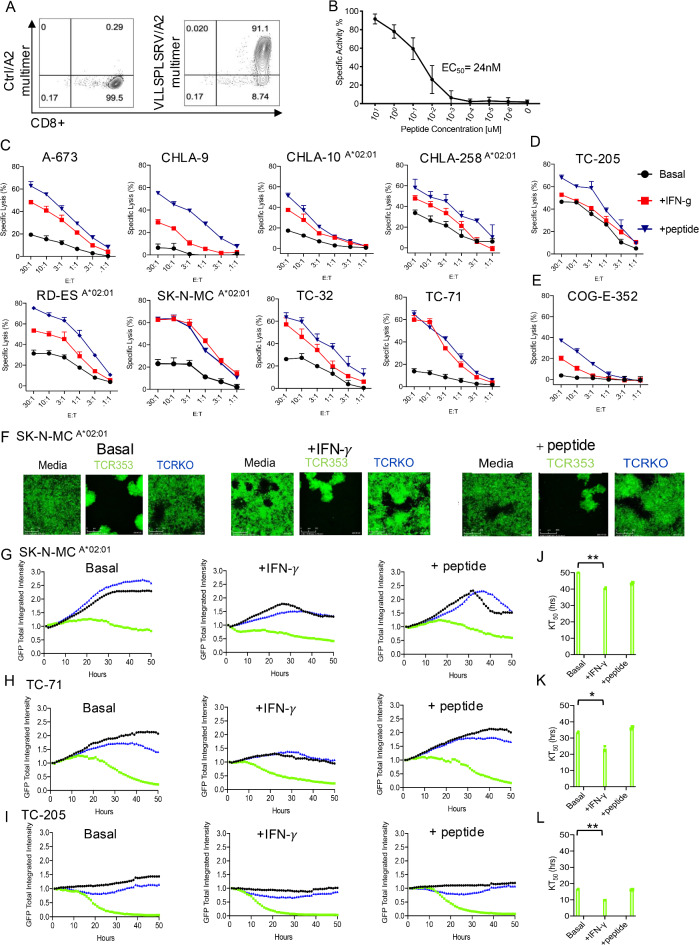
Ewing Sarcoma (EwS) is a rare pediatric malignancy characterized by a unique t(11:22) (q24;q12) translocation resulting in the pathognomonic EWSR1::FLI1 fusion. Recent reports indicate that the EWSR1::FLI1 oncofusion drives aberrant expression of numerous transcripts, including Lipoxygenase Homology Domains 1 (LOXHD1). Given its highly restricted protein expression pattern and role in EwS tumorigenesis and metastasis, LOXHD1 may serve as a novel immunotherapeutic target in this malignancy. LOXHD1 immunogenic epitopes restricted to HLA-A*02:01 allowed for the isolation of a high avidity αβTCR. LOXHD1-specific TCR engineered CD8+ T cells conferred cytotoxic activity against a panel of HLA-A*02:01+ EwS tumor cell lines and adoptive transfer led to tumor eradication in a mouse xenograft model of EwS. This study nominates LOXHD1 as an oncofusion regulated, non-mutated tumor associated antigen (TAA) with expression limited to inner hair cells of the cochlea, adult testis, and EwS.


Conflict of interest statement

Declarations. Competing interests: T.B, I.A.A., G.P.L., and B.M.C. are inventors on a patent (63/516,178) related to the targeting of LOXHD1 for immunotherapy entitled “Compositions and Methods for Targeting LOXHD1-Associated Disease”. All other authors have no competing interest to declare.

Figures

Fig. 1
Fig. 1
Identification of LOXHD1 candidate epitopes presented by SK-N-MCA*02:01, a EwS cell line. The SK-N-MCA*02:01 cell line was cultured under basal (media only) or inflammatory (100IU IFN-g /mL, 24 h) conditions, cell pellets collected and subjected to immunopeptidomics. MS/MS fragmentation patterns of HLA-A*02:01- restricted LOXHD1 peptides eluted under inflammatory conditions (A) FLGSVQIRV (aa766-774) and basal and inflammatory conditions (B) VLLSPLSRV (aa353-361) and KMADVDISTV (aa1604-1613) are shown. MS/MS profiles of eluted peptides (top) are compared to those of corresponding synthetic peptides (bottom) for accurate AA identity assignment. Binding affinities of (C) FLGSVQIRV (D) VLLSPLSRV and KMADVDISTV for HLA-A*02:01 was determined by fluorescence polarization competitive peptide-binding assays using titrated peptide concentrations. Peptides with HLA binding affinity < 3.7 nM (log10[IC50]) are classified as high binders. Characterization of immunoproteasome components in EwS cell lines was evaluated by western blot analysis. (E) Treatment with IFN-γ resulted in expression of β1i/LMP2 ~ 23 kDa, β5i/LMP7 ~ 30 kDa, β2i/PSMB10 ~ 29 kDa. None of immunoproteasome subunits were detected under basal conditions. β-actin expression serves as protein control. Please refer to Supplementary Fig. 2 for original western blots. Expression of (F) HLA-A*02:01 (BB7.2 mAb) and HLA class I (W6/32 mAb) molecules by EwS cell lines under basal (blue) and inflammatory (IFN-γ, red) conditions. Isotype control staining (orange) are shown. Flow analysis was performed a minimum of 2 times for each cell line and a representative experiment is shown.
Fig. 2
Fig. 2
Immunogenicity of LOXHD1 peptides and isolation of a LOXHD1-specific T cell receptor, TCR353. (A) Workflow for assessing LOXHD1-derived peptide immunogenicity, TCR isolation and validation. (B) HLA-A*02:01+ CD8+ T cells obtained from healthy donors (D224-D574) were stimulated twice with indicated peptides and responses were evaluated in an IFN-γ ELISPOT assay. IFN-γ ELISPOT Spot Forming Cell (SFC) values are subtracted from media controls for each donor and values > 100 SFCs per 5 × 105 CD8 + T cells (indicated by the dotted line) are considered positive. Representative data are the pooled results (triplicate) from single experiments of individual donors. Each donor is represented by distinct symbols. Red symbols represent positive IFN-γ ELISPOT responses. (C) VLLSPLSRV-specific HLA-A*02:01-restricted CD8 + T cell response isolated from D523 were confirmed by flow analysis using a custom VLLSPLSRV/A*02:01 (p-HLA) multimer and anti-CD8 Ab. No reactivity was observed with Ctrl/A2 (HIV/ HLA-A*02:01) multimer. (D) Circos plot represent TCR Vβ and TCR Vα family composition of TCR isolated from (C), and designated as TCR353. TCRα/β sequences were determined by next-generation DNA and RNA sequencing. (E) FACs plot demonstrating p-HLA multimer staining following TCR353 lentiviral transduction into the Jurkat reporter cell line JASP90. p-HLA staining of TCR353 transduced JASP90 (designated as JASP90_TCR353,red) and JASP90 are shown. A representative experiment of over 5 flow analyses is shown. (F) To evaluate TCR353 functionality, JASP90_TCR353 were cocultured with SK-N-MCA*02:01 cells (red) or SK-N-MCformula imageM_KO (blue) cell lines under basal, inflammatory (100IU/mL IFN-γ, 24 h) or peptide pulsed (10ug/mL peptide VLLSPLSRV) conditions. TCR activation is indicated by NFAT activation and readout via flow by expression of eGFP. A representative experiment of 4 experiment performed is shown.
Fig. 3
Fig. 3
Expression of TCR353 on CD8 + T cells confers lytic activity against EwS cell lines. (A) Primary CD8 + T cells were engineered to expressed TCR353 via lentiviral transduction and ablated for endogenous TCR expression using CRISPR/Cas9 editing. TCR353 expression was confirmed via flow cytometry using VLLSPLSRV/HLA-A*02:01 multimer/ anti-CD8 Ab staining. Staining with HIV/ HLA-A*02:01 multimer (Ctrl/A2) is shown as negative control. (B) Antigen avidity of TCR353 was determined in aCr release assay by co-culturing TCR transduced-CD8 + T cells (TCR353-T) with K562/A*02:01 + target cells pulsed with titrated peptide concentrations and lysis of target cells determined at 4 h. TCR avidity (EC50 = 24nM) was defined as the mean peptide concentration required to achieve 50% specific lysis. Recognition of EwS cell lines by TCR353-T cells. A panel of EwS cell lines expressing (C) EWSR1::FLI1 oncofusion (n = 8), (D) EWSR1::FEV oncofusion (n = 1), or (E) EWSR1::ERG (n = 1) oncofusion were tested either basal (black) or inflamatory (red) conditions as targets in a 4 hCr-release assay. VLLSPLSRV peptide-pulsed (10ug/mL, blue) targets are shown as positive controls. Percent-specific lysis (mean ± SD) is shown in triplicate for each data point. Two-way Anova for basal vs. IFN-g conditions: EWSR1::FLI1 targets, E:T ≥ 3:1, p < 0.001; EWSR1::FEV target, E:T ≥ 3:1, p > 0.5; EWSR1::ERG targets, E:T ≥ 10:1, p < 0.001. Long-term (> 24 h) recognition of selected EwS lines by TCR353-T cells using live cell imaging (tumor eGFP). (F) Representative images at 48 h comparing TCR353-T (green), TCRKO-T cells (endogenous TCR deleted, blue) lytic activity against SK-N-MCA*02:01 cultured under indicated condition. Quantification of tumor eGFP integrated intensity data upon TCR353-T (green) and TCRKO-T (blue) cultured with (G) SK-N-MCA*02:01, (H) TC-71. and (I) TC-205 as target in long-term cytoxicity assay. Tumor cell line cultured in media are represented by black line. TCR353-T lytic activity against (J) SK-N-MCA*02:01, (K) TC-71, and (L) TC-205 target cells represented as KT50 (hrs) is shown. KT50 is defined as time required to lyse 50% of target cells. Data represented at an E: T ratio of 3:1. Data are presented as mean values (n = 2) and representative of 2 independent experiments. t-test analysis for basal vs. IFN-γ conditions *p < 0.05, **p < 0.001.
Fig. 4
Fig. 4
Adoptive transfer of TCR353 T cells leads to in vivo eradication of EwS under basal and inflammatory conditions. (A) Schematic of SK-N-MCA*02:01 xenograft model. 2.5 × 105 CBR/Luciferase + SK-N-MCA*02:01 cells were engrafted subcutaneous into NSG mice via flank injection. Mice were treated with IFN-γ (500 IU) or PBS intratumorally and given 4 doses of 5 × 106 T cells as indicated. Mock, no T cells (Black) (n = 8), TCR353-T (red, n = 8) or TCRKO-T (blue, n = 8) cells. Tumor growth was monitored by bioluminescence (BLI) imaging. Representative bioluminescence imaging (n = 3 mice per group) of mock, TCRKO-T cell or TCR353-T cell treated under (B) basal or (C) inflammatory conditions. Total flux quantification of tumor growth under (D) basal and (E) inflammatory (+ IFN-γ) conditions in mock or T cell treated mice. Mean Total Flux (continuous lines), dots represent individual mice. One-way ANOVA followed by Tukey’s HSD post-test (day 34) comparing TCR353 vs. Mock under basal or under inflammatory conditions, ****p < 0.0001. No statistical difference between Mock and TCRKO-T control groups. Kaplan-Meier analysis of overall survival of SK-N-MCA*02:01 tumor bearing mice under (F) basal and (G) inflammatory conditions. Log-rank testing comparing TCR353-T and Mock under basal and inflammatory conditions (+ IFN-γ), ****p < 0.0001. No statistical difference between Mock and TCRKO-T control groups.

References

    1. Grunewald, T. G. P. et al. Ewing sarcoma. Nat. Rev. Dis. Primers. 4, 5. 10.1038/s41572-018-0003-x (2018). - PubMed
    1. Pappo, A. S., Dirksen, U. Rhabdomyosarcoma, Ewing sarcoma, and other round cell sarcomas. J. Clin. Oncol.36, 168–179. 10.1200/JCO.2017.74.7402 (2018). - PubMed
    1. Stahl, M. et al. Risk of recurrence and survival after relapse in patients with ewing sarcoma. Pediatr. Blood Cancer. 57, 549–553. 10.1002/pbc.23040 (2011). - PubMed
    1. Gaspar, N. et al. Ewing sarcoma: current management and future approaches through collaboration. J. Clin. Oncol.33, 3036–3046. 10.1200/JCO.2014.59.5256 (2015). - PubMed
    1. Delattre, O. et al. Gene fusion with an ETS DNA-binding domain caused by chromosome translocation in human tumours. Nature359, 162–165. 10.1038/359162a0 (1992). - PubMed

Substances

LinkOut - more resources