. 2025 May;7(5):1004-1017.
doi: 10.1038/s42255-025-01264-3. Epub 2025 Apr 15.

GDF15 links adipose tissue lipolysis with anxiety

Affiliations

GDF15 links adipose tissue lipolysis with anxiety

Logan K Townsend et al. Nat Metab. 2025 May.

Abstract

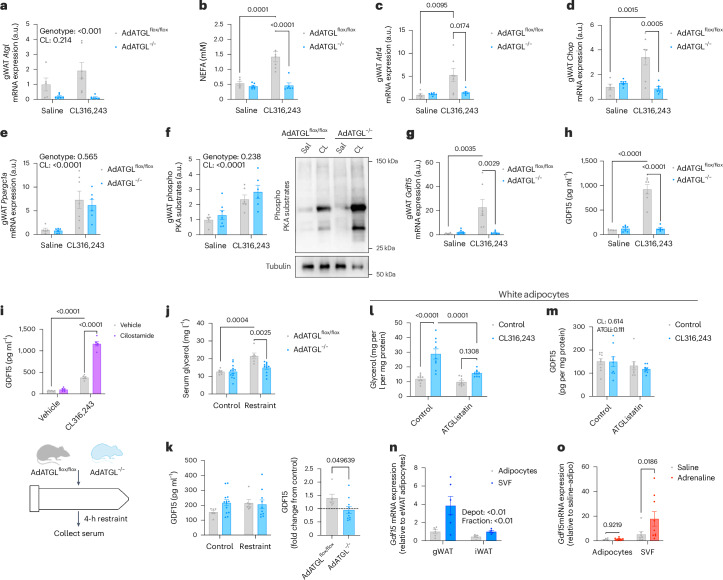
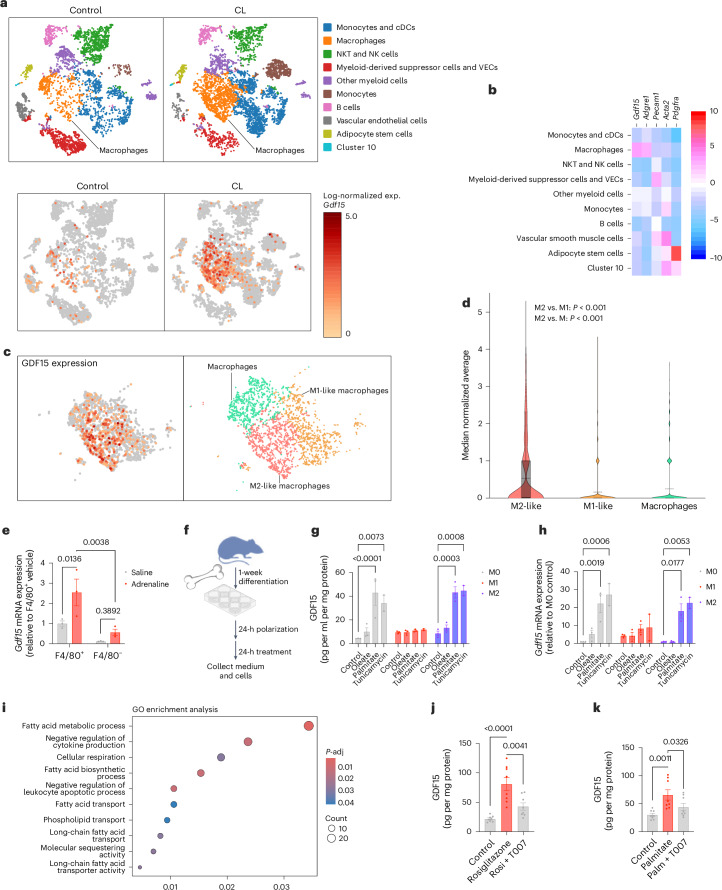
Psychological stress changes both behaviour and metabolism to protect organisms. Adrenaline is an important driver of this response. Anxiety correlates with circulating free fatty acid levels and can be alleviated by a peripherally restricted β-blocker, suggesting a peripheral signal linking metabolism with behaviour. Here we show that adrenaline, the β3 agonist CL316,243 and acute restraint stress induce growth differentiation factor 15 (GDF15) secretion in white adipose tissue of mice. Genetic inhibition of adipose triglyceride lipase or genetic deletion of β-adrenergic receptors blocks β-adrenergic-induced increases in GDF15. Increases in circulating GDF15 require lipolysis-induced free fatty acid stimulation of M2-like macrophages within white adipose tissue. Anxiety-like behaviour elicited by adrenaline or restraint stress is eliminated in mice lacking the GDF15 receptor GFRAL. These data provide molecular insights into the mechanisms linking metabolism and behaviour and suggest that inhibition of GDF15-GFRAL signalling might reduce acute anxiety.


Conflict of interest statement

Competing interests: G.R.S. is a cofounder and shareholder of Espervita Therapeutics, a company developing new medications for fibrosis and cancer. McMaster University has received funding from Cambrian Biosciences, Catalym, Espervita Therapeutics, Esperion Therapeutics, Merck, Nestle, Novo Nordisk and Poxel Pharmaceuticals for research conducted in the laboratory of G.R.S. G.R.S. has received consulting and speaking fees from AstraZeneca, CurieBio, Eli Lilly, Esperion Therapeutics, Korro Bio, Keros Therapeutics, Merck, Novo Nordisk, Versant Ventures and Poxel Pharmaceuticals. A.C.C. received consulting and speaking fees from Eli Lilly, HLS Therapeutics, Janssen, Novartis Pharmaceuticals Canada and Novo Nordisk Canada. The other authors declare no competing interests.

Figures

Fig. 1
Fig. 1. Acute psychological stress and adrenergic signalling increase GDF15 levels from gWAT.
a, Schematic of acute vehicle and adrenaline treatment and analyses. b, Top: time in the centre and total distance travelled during an open-field test 1 h following treatment with adrenaline (n = 14) or saline (n = 13). Bottom: representative images of movements of individual mice. Data are presented as mean ± s.e.m. with P values calculated using an unpaired two-tailed t test. c, Principal component analysis of gWAT samples from saline-treated (n = 6) and adrenaline-treated (n = 6) mice using VST data from DESeq2. d, Gene-concept network diagram indicating the corresponding enriched Gene Ontology (GO) terms according to DEGs between saline-treated (n = 6) and adrenaline-treated (n = 6) gWAT. e, Volcano plot showing DEGs identified between saline- and adrenaline-treated gWAT. The P-adj was calculated using the Benjamini–Hochberg method. FC, fold change. f, Time course of circulating GDF15 before and after adrenaline (n = 5 mice) or saline (n = 3) treatment. Data are presented as mean ± s.e.m. with P values calculated using an unpaired two-tailed t test. g, Tissue screen of Gdf15 in mice 1 h after adrenaline (n = 8) or saline (n = 9) treatment. Data are expressed relative to the saline-treated liver. Data are presented as mean ± s.e.m. with P values calculated using an unpaired two-tailed t test. ND, not detected; BAT, brown adipose tissue. h, Serum GDF15 levels in mice from the following groups: maintained in their home cage (n = 5), with cage change for 30 min (n = 8), group-housed (n = 6) or single-housed for 3 days (n = 8). Data are presented as mean ± s.e.m. with P values calculated using an unpaired two-tailed t test. i, Schematic of an acute restraint test in WT and Adrb1, Adrb2 and Adrb3 triple knockout (BR−/−) mice. j, Serum GDF15 levels in WT and BR−/− mice following 4 h of tube restraint (WT n = 10, BR−/− n = 14) or the control condition (WT n = 9, BR−/− n = 12). Data are presented as mean ± s.e.m. with P values calculated using a two-way ANOVA with post hoc testing and Tukey’s correction. k, gWAT Gdf15 expression levels in WT and BR−/− mice following 4 h of tube restraint (WT n = 6, BR−/− n = 7) or the control condition (WT n = 5, BR−/− n = 6). a.u., arbitrary units. Data are presented as mean ± s.e.m. with P values calculated using a two-way ANOVA with post hoc testing and Tukey’s correction. Source data
Fig. 2
Fig. 2. Adipocyte ATGL is critical for adrenergic-induced GDF15 secretion from the SVF.
ag, gWAT Atgl expression (a), serum nonesterified fatty acids (NEFA) (b), gWAT Atf4 expression (c), gWAT Chop expression (d), gWAT Ppargc1a expression (e), gWAT phosphorylated PKA substrates with a representative Western blot image (f) and gWAT Gdf15 expression in AdATGLflox/flox (saline n = 5, CL n = 7) and AdATGL−/− (saline n = 7, CL n = 6) mice (g). Data are presented as mean ± s.e.m. with P values calculated using a two-way ANOVA with post hoc testing and Tukey’s correction. h, Circulating GDF15 levels in AdATGLflox/flox (saline n = 5, CL n = 7) and AdATGL−/− (saline n = 7, CL n = 6) mice. Data are presented as mean ± s.e.m. with P values calculated using a two-way ANOVA with post hoc testing and Tukey’s correction. i, Top: serum GDF15 after 1 h of CL and cilostamide cotreatment in mice (n = 6 per group). Data are presented as mean ± s.e.m. with P values calculated using a two-way ANOVA with post hoc testing and Tukey’s correction. Bottom: schematic of the acute restraint test in AdATGLflox/flox and AdATGL−/− mice. j, Serum glycerol levels in AdATGLflox/flox mice (control n = 6, restraint n = 6) and AdATGL−/− mice (control n = 13, restraint n = 11) following restraint. Data are presented as mean ± s.e.m. with P values calculated using a two-way ANOVA with post hoc testing and Tukey’s correction. k, Left: serum GDF15 in AdATGLflox/flox mice (control n = 6, restraint n = 6) and AdATGL−/− mice (control n = 13, restraint n = 11). Right: graph showing the fold change. Data are presented as mean ± s.e.m. with P values calculated using a two-way ANOVA (left) and an unpaired two-tailed t test (right). l, Glycerol levels in medium from white adipocytes treated with CL and/or ATGListatin (n = 9 per group; individual data points from three independent experiments). Data are presented as mean ± s.e.m. with P values calculated using a two-way ANOVA with post hoc testing and Tukey’s correction. m, GDF15 levels in medium from white adipocytes treated with CL and/or ATGListatin (n = 9 per group; individual data points from three independent experiments). Data are presented as mean ± s.e.m. with P values calculated using a two-way ANOVA. n, Gdf15 expression in adipocytes and SVF from gWAT (n = 6) and iWAT (n = 5) of mice. Data are presented as mean ± s.e.m. with P values calculated using a two-way ANOVA. o, Gdf15 expression in adipocytes and SVF from gWAT 1 h after saline (n = 7) or adrenaline (n = 9) treatment. Data are presented as mean ± s.e.m. with P values calculated using a two-way ANOVA with post hoc testing and Tukey’s correction. Source data
Fig. 3
Fig. 3. Adipocyte lipolysis mediates GDF15 secretion from alternatively activated M2-like macrophages through fatty acids.
a, Top: t-distributed stochastic neighbour embedding plot of stromal vascular cells from gWAT of mice treated with CL for 3 days. Clustering identified ten major cell types or states. cDCs, conventional dendritic cells; NKT, natural killer T; NK, natural killer; VECs, vascular endothelial cells. Bottom: data were queried for cell clusters expressing Gdf15. exp., expression. b, Heat map showing the expression of Gdf15 and other cell-identifying factors in the various cell populations identified in scRNA-seq data. c, Data were queried to determine Gdf15 expression in the identified macrophage populations. d, Median normalized average Gdf15 expression in the M2-like, M1-like and macrophage populations from CL-treated mouse scRNA-seq data. The box-and-whisker plot is defined by the median (centre line) with the first quartile (Q1, lower line), third quartile (Q3, upper line), maximum (Q1 − 1.5 × interquartile range) and minimum (Q3 + 1.5 × interquartile range). Whiskers: 1.5 × (Q3 − Q1). P values were calculated using a one-way ANOVA with Benjamini–Hochberg correction for multiple tests. e, Gdf15 expression in mouse F4/80+ and F4/80 fractions (n = 3 per group). Data are presented as mean ± s.e.m. with P values calculated using a two-way ANOVA with post hoc testing and Tukey’s correction. f, Experimental schematic of the isolation, activation and treatment of BMDMs. g, GDF15 levels in medium from BMDMs treated with fatty acids (n = 3) or tunicamycin (n = 2). Individual data points represent triplicates from three independent experiments. Data are presented as mean ± s.e.m. with P values calculated using a two-way ANOVA with post hoc testing and Tukey’s correction. h, Gdf15 expression in BMDMs treated with fatty acids (n = 3) or tunicamycin (n = 2). Data points represent triplicates from three independent experiments. Data are presented as mean ± s.e.m. with P values calculated using a two-way ANOVA with post hoc testing and Tukey’s correction. i, GO enrichment analysis of M1- and M2-like macrophage populations from scRNA-seq data. The P-adj was calculated using the Benjamini–Hochberg method. j, GDF15 levels in medium from M2-like BMDMs treated with rosiglitazone (Rosi) or T0070907 (T007) (n = 9 per group). Individual data points represent triplicates from three independent experiments. Data are presented as mean ± s.e.m. with P values calculated using a one-way ANOVA with post hoc testing and Tukey’s correction. k, GDF15 levels in medium from M2-like BMDMs treated with palmitate (Palm) or T0070907 (T007) (n = 9 per group). Individual data points represent triplicates from three independent experiments. Data are presented as mean ± s.e.m. with P values calculated using a one-way ANOVA with post hoc testing and Tukey’s correction. f created using BioRender.com. Source data
Fig. 4
Fig. 4. GDF15 regulates behavioural and physiological responses to acute psychological stress through multiple anxiogenic brain regions.
a, Time in the centre during the open-field test following treatment with saline (WT n = 5 mice, Gfral−/− n = 6) or adrenaline (WT n = 6, Gfral−/− n = 6). Data are presented as mean ± s.e.m. with P values calculated using a two-way ANOVA with post hoc testing and Tukey’s correction. b, Top: total movement during the open-field test following treatment with saline (WT n = 5, Gfral−/− n = 6) or adrenaline (WT n = 6, Gfral−/− n = 6). Bottom: representative images of movements of individual mice. Data are presented as mean ± s.e.m. with P values calculated using a two-way ANOVA with post hoc testing and Tukey’s correction. c, Left: schematic of the acute restraint test. Right: time in the centre during the open-field test following 4 h of tube restraint (WT n = 11 mice, Gfral−/− n = 8) or the control condition (WT n = 10, Gfral−/− n = 9). Data are presented as mean ± s.e.m. with P values calculated using a two-way ANOVA with post hoc testing and Tukey’s correction. d, Total distance travelled during the open-field test following restraint (WT n = 11 mice, Gfral−/− n = 9) or the control condition (WT n = 10, Gfral−/− n = 9). Data are presented as mean ± s.e.m. with P values calculated using a two-way ANOVA. e, Top: quantification of c-Fos+ cells in the bed nucleus of the stria terminalis (BNST), central amygdala (CeA) and paraventricular nucleus of the hypothalamus (PVN) of mice 90 min following treatment with IP injected GDF15. Bottom: representative pictures of the staining (n = 4 per group). Data are presented as mean ± s.e.m. with P values calculated using an unpaired two-tailed t test. Scale bar, 200 µm. 3V, third ventricle; ac, anterior commissure; BLA, basolateral amygdala; LV, lateral ventricle. f, Serum corticosterone following restraint (WT n = 9 mice, Gfral−/− n = 8) or the control condition (WT n = 9, Gfral−/− n = 8). Data are presented as mean ± s.e.m. with P values calculated using a two-way ANOVA with post hoc testing and Tukey’s correction. g, Serum GDF15 after treatment with CRH (WT n = 5 mice, Gfral−/− n = 6) or vehicle (WT n = 3, Gfral−/− n = 4). Data are presented as mean ± s.e.m. with P values calculated using a two-way ANOVA with post hoc testing and Tukey’s correction. h, Schematic summary of the mechanism of GDF15-mediated anxiety-like behaviour. h created using BioRender.com. Source data
Extended Data Fig. 1
Extended Data Fig. 1. Sex- and housing temperature-independent effects of exogenous epinephrine on GDF15.
a) Pathway analysis from RNA-sequencing of gWAT following 1-hr epinephrine treatment. n = 6 per group. b) Heat map showing ligand-encoded genes from RNA-sequencing of gWAT following 1-hr epinephrine treatment. n = 6 per group. c) Circulating GDF15 from age-matched male (saline n = 9, epinephrine n = 9) and female mice (saline n = 10, epinephrine n = 11) following 1-hr epinephrine with fold-change relative to baseline levels (inset). Data presented as mean ± s.e.m. with p-values calculated using 2-way ANOVA with post-hoc test and Tukey’s correction and unpaired two-tail t-test, respectively. d) Time-course of circulating GDF15 post-saline (RT n = 5, TN n = 4) or epinephrine (RT n = 5, TN n = 5) in mice housed at room temperature (RT ~ 22 °C) or thermoneutrality (TN ~ 29 °C) for 4 weeks. n = 4-5/group. Data presented as mean ± s.e.m. with p-values calculated using 2-way ANOVA at each time point. e) Serum epinephrine in control (n = 9 mice), 1-hr post IP epinephrine (n = 7), and 4-hr physical restraint (n = 8). Data presented as mean ± s.e.m. with p-values calculated using 1-way ANOVA with post-hoc test and Tukey’s correction. Source data
Extended Data Fig. 2
Extended Data Fig. 2. Chronic psychological stress not associated with elevated circulating GDF15 levels in humans.
a) Serum GDF15 levels in children with overweight and obesity with (n = 23) or without (n = 24) diagnosis of anxiety. Data presented as mean ± s.e.m. with p-values calculated using unpaired two-tail t-test. b) Scatter plot of the SNP-effect on GDF15 and single nucleotide polymorphism (SNP)-effect on nervous anxiety tension or depression in humans by using two sample Mendelian Randomization (2SMR). Data presented as mean ± error bars indicate 95% CI, n = 407,746 participants in UK Biobank. MR analysis was performed by using Simple median method, MR weighted mode estimator, Weighted median method, MR Egger regression, Inverse variance weighted methods. c) Single SNP analysis of GDF15 on anxiety and depression in humans, Data presented as mean ± error bars indicate 95% CI, n = 407,746 participants in UK Biobank. Source data
Extended Data Fig. 3
Extended Data Fig. 3. Effects of LPS in beta receptor knockout mice.
a) Serum GDF15 from WT and β-adrenergic receptor knockout (BR-/-) mice following 2-hr LPS treatment (WT n = 6, BR-/- n = 6) or control (WT n = 6, BR-/- n = 8). Data presented as mean ± s.e.m. with p-values calculated using 2-way ANOVA. b) Blood glucose from WT and BR-/- mice following 2-hr LPS treatment (WT n = 6, BR-/- n = 6) or control (WT n = 6, BR-/- n = 8). Data presented as mean ± s.e.m. with p-values calculated using 2-way ANOVA. Source data
Extended Data Fig. 4
Extended Data Fig. 4. Restraint stress in AdATGLflox/flox and AdATGL-/- mice.
a) Blood glucose levels in AdATGLflox/flox mcie (control n = 6, restraint n = 6) and AdATGL-/- (control n = 13, restraint n = 11). Data presented as mean ± s.e.m. with p-values calculated using 2-way ANOVA with post-hoc test and Tukey’s correction. b) Total distance for AdATGLflox/flox mice (control n = 6, restraint n = 6) and AdATGL-/- (control n = 13, restraint n = 11) during open-field test. Data presented as mean ± s.e.m. with p-values calculated using 2-way ANOVA with post-hoc test and Tukey’s correction. c) Time in the centre for AdATGLflox/flox mice (control n = 6, restraint n = 6) and AdATGL-/- (control n = 13, restraint n = 11) during open-field test. Data presented as mean ± s.e.m. with no statistical test performed. Source data
Extended Data Fig. 5
Extended Data Fig. 5. Macrophages are the most likely source of GDF15 within adipose tissue.
a) Fgf21 expression in mouse adipocyte and SVF from gWAT post-saline (n = 4 per group) or epinephrine (n = 5 per group). Data presented as mean ± s.e.m. with p-values calculated using 2-way ANOVA with post-hoc test and Tukey’s correction. b) Leptin expression in mouse adipocyte and SVF from gWAT post-saline (n = 3 per group) or epinephrine (n = 4 per group). Data presented as mean ± s.e.m. with p-values calculated using 2-way ANOVA. c) t-SNE plot of Lin- stromal vascular cells from gWAT of control mice and mice treated with CL for 3 days. Clustering identified 6 major cell types/states. Clusters are highlighted in different colors. The data set was queried for cells expressing Gdf15. Heatmap shows expression of Gdf15 and other cell-identifying factors in the various identified cell populations. d) F480/Adgre1 expression in mouse F480+ and F480- fractions of SVF from gWAT 1-hr post-epinephrine treatment (0.5 mg/kg). Data presented as mean ± s.e.m. with n = 3 per group. p-values calculated using 2-way ANOVA. e) Arg1 and Nos2 expression in bone marrow-derived macrophages (BMDMs) polarized to either M1-like or M2-like. n = 6 per group. Individual data points represent duplicates from 3 independent experiments. Data presented as mean ± s.e.m. with p-values calculated using 1-way ANOVA with post-hoc test and Tukey’s correction. f) GDF15 levels in media from BMDMs polarized to either M1-like or M2-like for 24-hrs. n = 3 per group. Individual data points represent triplicates from 3 independent experiments. Data presented as mean ± s.e.m. with p-values calculated using 1-way ANOVA with post-hoc test and Tukey’s correction. g) GDF15 levels in media from M2-like BMDMs treated with epinephrine (1 μM) or tunicamycin (5 ng/mL) for 24-hrs. n = 3 per group. Individual data points represent triplicates from 3 independent experiments. Data presented as mean ± s.e.m. with p-values calculated using 1-way ANOVA with post-hoc test and Tukey’s correction. h) Volcano plot showing fatty acid transporters identified between M1- and M2-like macrophage populations from scRNA-seq data. Source data
Extended Data Fig. 6
Extended Data Fig. 6. Lipids and anxiety.
a) Time in the centre during open-field test (% total) following 4-hr palm oil gavage (10 mL/kg) gavage in WT and Gfral -/- mice. n = 8 per group. Data presented as mean ± s.e.m. with p-values calculated using 2-way ANOVA. b) Time in the centre during open-field test for chow (WT n = 6 mice, Gfral-/- n = 6) or 4-week high-fat diet fed mice (WT n = 7 mice, Gfral-/- n = 6). Data presented as mean ± s.e.m. with p-values calculated using 2-way ANOVA. c) Total distance traveled during open-field test for chow (WT n = 6 mice, Gfral-/- n = 6) or 4-week high-fat diet fed mice (WT n = 7 mice, Gfral-/- n = 6). Data presented as mean ± s.e.m. with p-values calculated using 2-way ANOVA. Source data
Extended Data Fig. 7
Extended Data Fig. 7. GDF15-GFRAL signalling is important for behavioural responses to epinephrine.
a) Non-ambulatory movements, b) Total physical activity, c) Total food intake, d) respiratory exchange ratio (RER), e) Energy expenditure in WT (saline n = 4, epinephrine n = 4) and Gfral-/- mice (saline n = 4, epinephrine n = 4). Data presented as mean ± s.e.m. with p-values calculated using 2-way ANOVA with post-hoc test and Tukey’s correction. f) Chow intake (18-hrs) following tube restraint in WT (control n = 7, restraint n = 7) and Gfral -/- mice (control n = 10, restraint n = 9). Data presented as mean ± s.e.m. with p-values calculated using 2-way ANOVA. g) Kaolin clay intake (18-hrs) following tube restraint in WT (control n = 7, restraint n = 7) and Gfral -/- mice (control n = 10, restraint n = 9). Data presented as mean ± s.e.m. with p-values calculated using 2-way ANOVA. h) Time in center and total distance during open-field test following GDF15 treatment with representative images showing movement of individual mice. n = 9 per group. Data presented as mean ± s.e.m. with p-values calculated using unpaired two-tail t-test. i) Time in light during light-dark box test following vehicle (n = 8) or GDF15 treatment (n = 9). Data presented as mean ± s.e.m. with p-values calculated using unpaired two-tail t-test. j) Daily chow food intake throughout repeated GDF15 (5 nM/kg IP). n = 12 per group. Data presented as mean ± s.e.m. with p-values calculated using 2-way ANOVA with post-hoc test and Tukey’s correction. k) Time in the center during open-field test following GDF15 treatment (5 nM/kg IP) with representative images of movement of individual mice. n = 6 per group. Data presented as mean ± s.e.m. with p-values calculated using 2-way ANOVA. Chr. GDF15: Chronic GDF15. l) Total distance traveled during open-field test following GDF15 treatment (5 nM/kg IP) with representative images showing representative movement of individual mice. n = 6 per group. Data presented as mean ± s.e.m. with p-values calculated using 2-way ANOVA. Chr. GDF15: Chronic GDF15. Source data
Extended Data Fig. 8
Extended Data Fig. 8. Neither the locus coeruleus, nor its angiogenic downstream brain regions, are activated by GDF15.
a) Quantification of c-Fos positive cells in the locus coeruleus 90-min following GDF15 treatment (5 nm/kg IP), with representative pictures of the staining for TH and c-Fos. n = 4 per group. Data presented as mean ± s.e.m. with p-values calculated using unpaired two-tail t-test. Scale bar=200 µm. 4 V: 4th ventricle, LC: locus coeruleus, TH: tyrosine hydroxylase. b) Quantification of c-Fos positive cells in the PFC and BLA 90-min following GDF15 treatment (5 nm/kg IP), with representative pictures of the staining. n = 4 per group. Data presented as mean ± s.e.m. with p-values calculated using unpaired two-tail t-test. Scale bar=200 µm. BLA: basolateral amygdala, cc: corpus callosum, mPFC: medial prefrontal cortex. c) Serum GDF15 in WT (control n = 9, restraint n = 9) and Gfral -/- mice (control n = 8, restraint n = 8). Data presented as mean ± s.e.m. with p-values calculated using 2-way ANOVA with Tukey’s post-hot correction. d) Serum corticosterone in WT (control n = 4, CRH n = 6) and Gfral -/- mice (control n = 4, CRH n = 6). Data presented as mean ± s.e.m. with p-values calculated using 2-way ANOVA at each timepoint. e) Serum adrenocorticotropic hormone (ACTH) in WT (control n = 4, CRH n = 6) and Gfral -/- mice (control n = 4, CRH n = 6). Data presented as mean ± s.e.m. with p-values calculated using 2-way ANOVA at each timepoint. f) Serum corticosterone 6-hr post treatment with dexamethasone (Dexa, 100 µg/kg IP). n = 4 per group. Data presented as mean ± s.e.m. with p-values calculated using 2-way ANOVA. Source data

References

    1. Kessler, R. C., Chiu, W. T., Demler, O., Merikangas, K. R. & Walters, E. E. Prevalence, severity, and comorbidity of 12-month DSM-IV disorders in the National Comorbidity Survey Replication. Arch. Gen. Psychiatry62, 617–627 (2005). - PMC - PubMed
    1. Ulrich-Lai, Y. M. & Herman, J. P. Neural regulation of endocrine and autonomic stress responses. Nat. Rev. Neurosci.10, 397–409 (2009). - PMC - PubMed
    1. McCall, J. G. et al. CRH engagement of the locus coeruleus noradrenergic system mediates stress-induced anxiety. Neuron87, 605–620 (2015). - PMC - PubMed
    1. McCall, J. G. et al. Locus coeruleus to basolateral amygdala noradrenergic projections promote anxiety-like behavior. eLife6, e18247 (2017). - PMC - PubMed
    1. Burns, T. W., Mohs, J. M., Langley, P. E., Yawn, R. & Chase, G. R. Regulation of human lipolysis. In vivo observations on the role of adrenergic receptors. J. Clin. Invest.53, 338–341 (1974). - PMC - PubMed

Substances