. 2025 Apr 15;15(1):12938.
doi: 10.1038/s41598-025-96835-5.

Permeability scaling relationships of volcanic tuff from core to field scale measurements

Collaborators, Affiliations

Permeability scaling relationships of volcanic tuff from core to field scale measurements

Dolan D Lucero et al. Sci Rep. .

Abstract

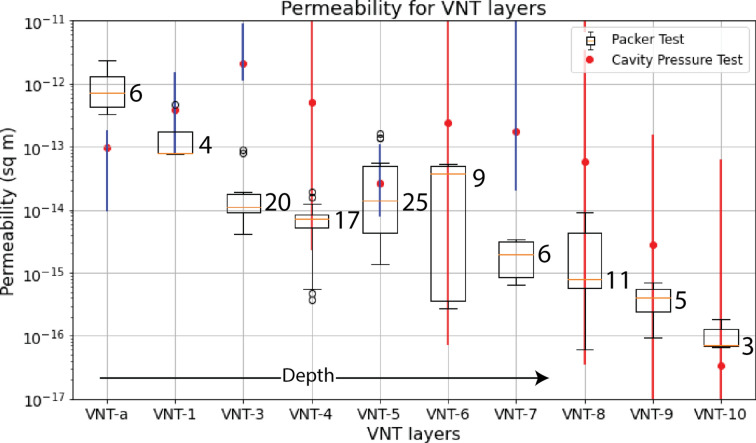
A recent chemical explosive test in P-Tunnel at the Nevada National Security Site, Nevada, USA, was conducted to better understand how signals propagate from explosions in the subsurface. A primary signal of interest is the migration of gases that can be used to differentiate chemical from nuclear explosions. Gas migration is highly dependent on the rock permeability which is notoriously difficult to determine experimentally in the field due to a potentially large dependence on the scale over which measurements are made. Here, we present pre-explosion permeability estimates to characterize the geologic units surrounding the recent test. Permeability measurements were made at three scales of increasing size: core samples (≈2 cm), borehole packer system tests (≈1 m), and a pre-shot cavity pressurization test (> 10 m) across ten tuff units. Permeability estimates based on core measurements showed little difference from borehole packer tests. However, permeability in most rock units calibrated from cavity pressurization tests resulted in higher permeability estimates by up to two orders of magnitude. Here, we demonstrate that the scale of the measurement significantly impacts the characterization efforts of hydraulic properties in volcanic tuff, and that local-scale measurements (< 10 m scale) do not incorporate enough heterogeneity to accurately predict field-scale flow and mass transport.


Conflict of interest statement

Declarations. Competing interests: The authors declare no competing interests.

Figures

Fig. 1
Fig. 1
(A) Location of the Nevada National Security Site, Aqueduct Mesa (red box) which houses U12p Tunnel (P-Tunnel). (B) Cross section of Aqueduct Mesa from X – X’ in (C). The layers correspond to the following lithologies: upper nonwelded to partially welded tuff (UNPWT), upper welded tuff (UWT), vitric nonwelded tuff (VNT), and upper zeolitic nonwelded tuff (UZNT). (C) Topographic contours of Aqueduct Mesa and P-Tunnel Complex. Yellow stars represent the locations of the Physical Experiment 1 (PE1) chemical explosion experiments (PE1-A, -B, and -DL). Figure modified from Myers et al. (2024).
Fig. 2
Fig. 2
Model domains of the two permeability experiments. (A) Dual packer assembly with dashed box showing the model domain (C). Boundary conditions (BC) are labeled on the domain edges (Const P = Constant Pressure). Dimensions of packer assemblies differ between tests (Supplementary Figure S1). (B) Model domain and boundary conditions of the cavity pressurization test simulation. Dashed box (B) shows the VNT units and positions of the GS pressure transducers (D). Translation of GS-1–8 preserves the distance from the cavity to the sampler and the host VNT layer.
Fig. 3
Fig. 3
Calibrated permeability from the cavity pressurization test (top left panel; values from Table 2, S2). Four VNT units contain GS samplers: VNT1 (GS-2), VNT5 (GS-1 and 3), VNT 8 (GS-5) and VNTa (GS-4, 6 and 8). Pumping rates into the cavity during the test are shown in Figure S2. Simulated (dashed lines) versus observed (solid lines) pressure signals at GS samplers and cavity during the cavity pressurization test from PEST calibration. The pressure observations used as PEST calibration targets are shown as black stars.
Fig. 4
Fig. 4
Composite VNT permeability obtained from PEST/FEHM numerical models in this study (116 measurements total). VNT-a is the shallowest unit. Depth increases from VNT-a to VNT-10. The line, whiskers and black open circles of the box plots are the median, 95% confidence interval and outliers of the packer test permeability distribution. Circle and error bars for the cavity pressurization test represent the calibrated permeability and 95% confidence interval, respectively. Error bars that extend beyond the range of PEST permeability estimates are labeled in red, indicating they are relatively insensitive to the calibration process.
Fig. 5
Fig. 5
Simulated (lines) and observed (blue dots) pressure signal at GS-1 during the cavity pressurization test with three different permeability scenarios: 1) Inverted permeability from the cavity pressurization test, 2) maximum and 3) minimum inverted permeability from the packer tests.
Fig. 6
Fig. 6
Permeability estimates of volcanic tuffs performed at three scales: 1) laboratory-analyzed core samples, 2) single-hole packer tests (calibrated), and 3) cross-hole pumping tests/cavity pressurization test (calibrated). The orange line, whiskers and black circles of the box plots are the median, 95% confidence interval and outliers of the permeability distribution. The data were obtained from the Apache Leap Research Site, AZ (ALRS, 1309 measurements),,, Yucca Mountain, NV (YM, 25 measurements), and the Nevada National Security Site, NV (NNSS, 116 measurements in this study and 8 measurements in Reference 11). Scale of the measurements are based on the size of the core, pressurized interval in packer tests, and maximum distance between packers in cross-hole and cavity pressurization tests.

References

    1. Myers, S. C., Abbot, G., Alexander, T., Alger, E., Alvarez, A., et al. A Multi-Physics Experiment for Low-Yield Nuclear Explosion Monitoring. Lawrence Livermore National Laboratory Report. LLNL-TR-864107. (2024).
    1. Sun, Y. & Carrigan, C. R. Modeling noble gas transport and detection for the comprehensive nuclear-test-ban treaty. Pure Appl. Geophys.171, 735–750. 10.1007/s00024-012-0514-4 (2014).
    1. Carrigan, C. R. et al. Delayed signatures of underground nuclear explosions. Sci. Rep.6, 23032. 10.1038/srep23032 (2016). - PMC - PubMed
    1. Bourret, S. M., Kwicklis, E. M., Harp, D. R., Ortiz, J. P. & Stauffer, P. H. Beyond Barnwell: applying lessons learned from the Barnwell site to other historic underground nuclear tests at Pahute Mesa to understand radioactive gas-seepage observations. J. Environ. Radioact.222, 106297. 10.1016/j.jenvrad.2020.106297 (2020). - PubMed
    1. Bourret, S. M., Kwicklis, E. M., Miller, T. A. & Stauffer, P. H. Evaluating the importance of barometric pumping for subsurface gas transport near an underground nuclear test site. Vadose Zone J18(1), 180134. 10.2136/vzj2018.07.0134 (2019).

LinkOut - more resources