. 2025 Apr 15;8(1):209.
doi: 10.1038/s41746-025-01504-6.

Network analysis of extraintestinal manifestations and associated autoimmune disorders in Crohn's disease and ulcerative colitis

Affiliations

Network analysis of extraintestinal manifestations and associated autoimmune disorders in Crohn's disease and ulcerative colitis

Daniel C Baumgart et al. NPJ Digit Med. .

Abstract

We detect and interactively visualize occurrence, frequency, sequence, and clustering of extraintestinal manifestations (EIM) and associated immune disorders (AID) in 30,334 inflammatory bowel disease (IBD) patients (Crohn's disease (CD) n = 15924, ulcerative colitis (UC) n = 11718, IBD unclassified, IBD-U n = 2692, 52% female, median age 40 years (IQR: 25)) with artificial intelligence (AI). 57% (CD > UC 60% vs. 54%, p < 0.00001) had one or more EIM and/or AID. Mental, musculoskeletal and genitourinary disorders were most frequently associated with IBD: 18% (CD vs. UC 19% vs. 16%, p < 0.00001), 17% (CD vs. UC 20% vs. 15%, p < 0.00001) and 11% (CD vs. UC 13% vs. 9%, p < 0.00001), respectively. AI detected 4 vs. 5 vs. 5 distinct EIM/AID communities with 420 vs. 396 vs. 467 nodes and 11,492 vs. 9116 vs. 16,807 edges (links) in CD vs. UC vs. IBD, respectively. Our newly developed interactive free web app shows previously unknown communities, relationships, and temporal patterns-the diseasome and interactome.


Conflict of interest statement

Competing interests: The opinions expressed in this manuscript are the author’s own and do not necessarily reflect those of the University of Alberta, Alberta Health Services (AHS), Alberta Health (AH), or other Government of Alberta entities. The authors declare no competing interests.

Figures

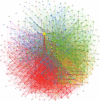
Fig. 1
Fig. 1. Louvain community network detection analysis of extraintestinal manifestations in inflammatory bowel disease.
Most EIM and AID associated with IBD occur in two large clusters that appear in blue and yellow, three smaller red, green, and purple clusters. Click here for the interactive version Interactive Figure 1.
Fig. 2
Fig. 2. Louvain Community Network Detection Analysis of Extraintestinal Manifestations in Crohn’s Disease.
Most EIM and AID associated with CD occur in two large clusters that appear in blue and yellow and two smaller green and red clusters. Click here for the interactive version Interactive Figure 2.
Fig. 3
Fig. 3. Louvain community network detection analysis of extraintestinal manifestations in ulcerative colitis.
Most EIM and AID associated with UC occur in two large clusters that appear in green and red, two smaller red and blue clusters, and one very small purple cluster. Click here for the interactive version Interactive Figure 3 in the online supplement.
Fig. 4
Fig. 4. EIM and AID community overlap score by shuffling ICD co-occurrence edge list.
Error bars represent SEM. The lightly colored bar gives the mean community overlap score for 1000 pairs of randomly generated communities. The x-axis values indicate the quantile of ICD frequencies in the patient population that was used to threshold the ICD codes that were included in the overlap score calculation. ICD codes whose frequencies in the patient population fell in the quantiles stated along the x-axis were included in the overlap score calculation.
Fig. 5
Fig. 5. EIM and AID community overlap score on random disjoint samples of patients.
Error bars represent SEM. The lightly colored bar gives the mean community overlap score for 1000 pairs of randomly generated communities. The x-axis values indicate the quantile of ICD frequencies in the patient population that was used to threshold the ICD codes that were included in the overlap score calculation. ICD codes whose frequencies in the patient population fell in the quantiles stated along the x-axis were included in the overlap score calculation.

References

    1. Baumgart, D. C. Crohn’s Disease and Ulcerative Colitis - From Epidemiology and Immunobiology to a Rational Diagnostic and Therapeutic Approach 2nd edn 10.1007/978-3-319-33703-6 (Springer Nature, 2017).
    1. Baumgart, D. C. & Sandborn, W. J. Crohn’s disease. Lancet380, 1590–1605 (2012). - PubMed
    1. Ordas, I., Eckmann, L., Talamini, M., Baumgart, D. C. & Sandborn, W. J. Ulcerative colitis. Lancet380, 1606–1619 (2012). - PubMed
    1. Lloyd-Price, J. et al. Multi-omics of the gut microbial ecosystem in inflammatory bowel diseases. Nature569, 655–662 (2019). - PMC - PubMed
    1. Graham, D. B. & Xavier, R. J. Pathway paradigms revealed from the genetics of inflammatory bowel disease. Nature578, 527–539 (2020). - PMC - PubMed

LinkOut - more resources