. 2025 Jul;6(7):1157-1172.
doi: 10.1038/s43018-025-00949-8. Epub 2025 Apr 15.

Overcoming extracellular vesicle-mediated fratricide improves CAR T cell treatment against solid tumors

Affiliations

Overcoming extracellular vesicle-mediated fratricide improves CAR T cell treatment against solid tumors

Wenqun Zhong et al. Nat Cancer. 2025 Jul.

Abstract

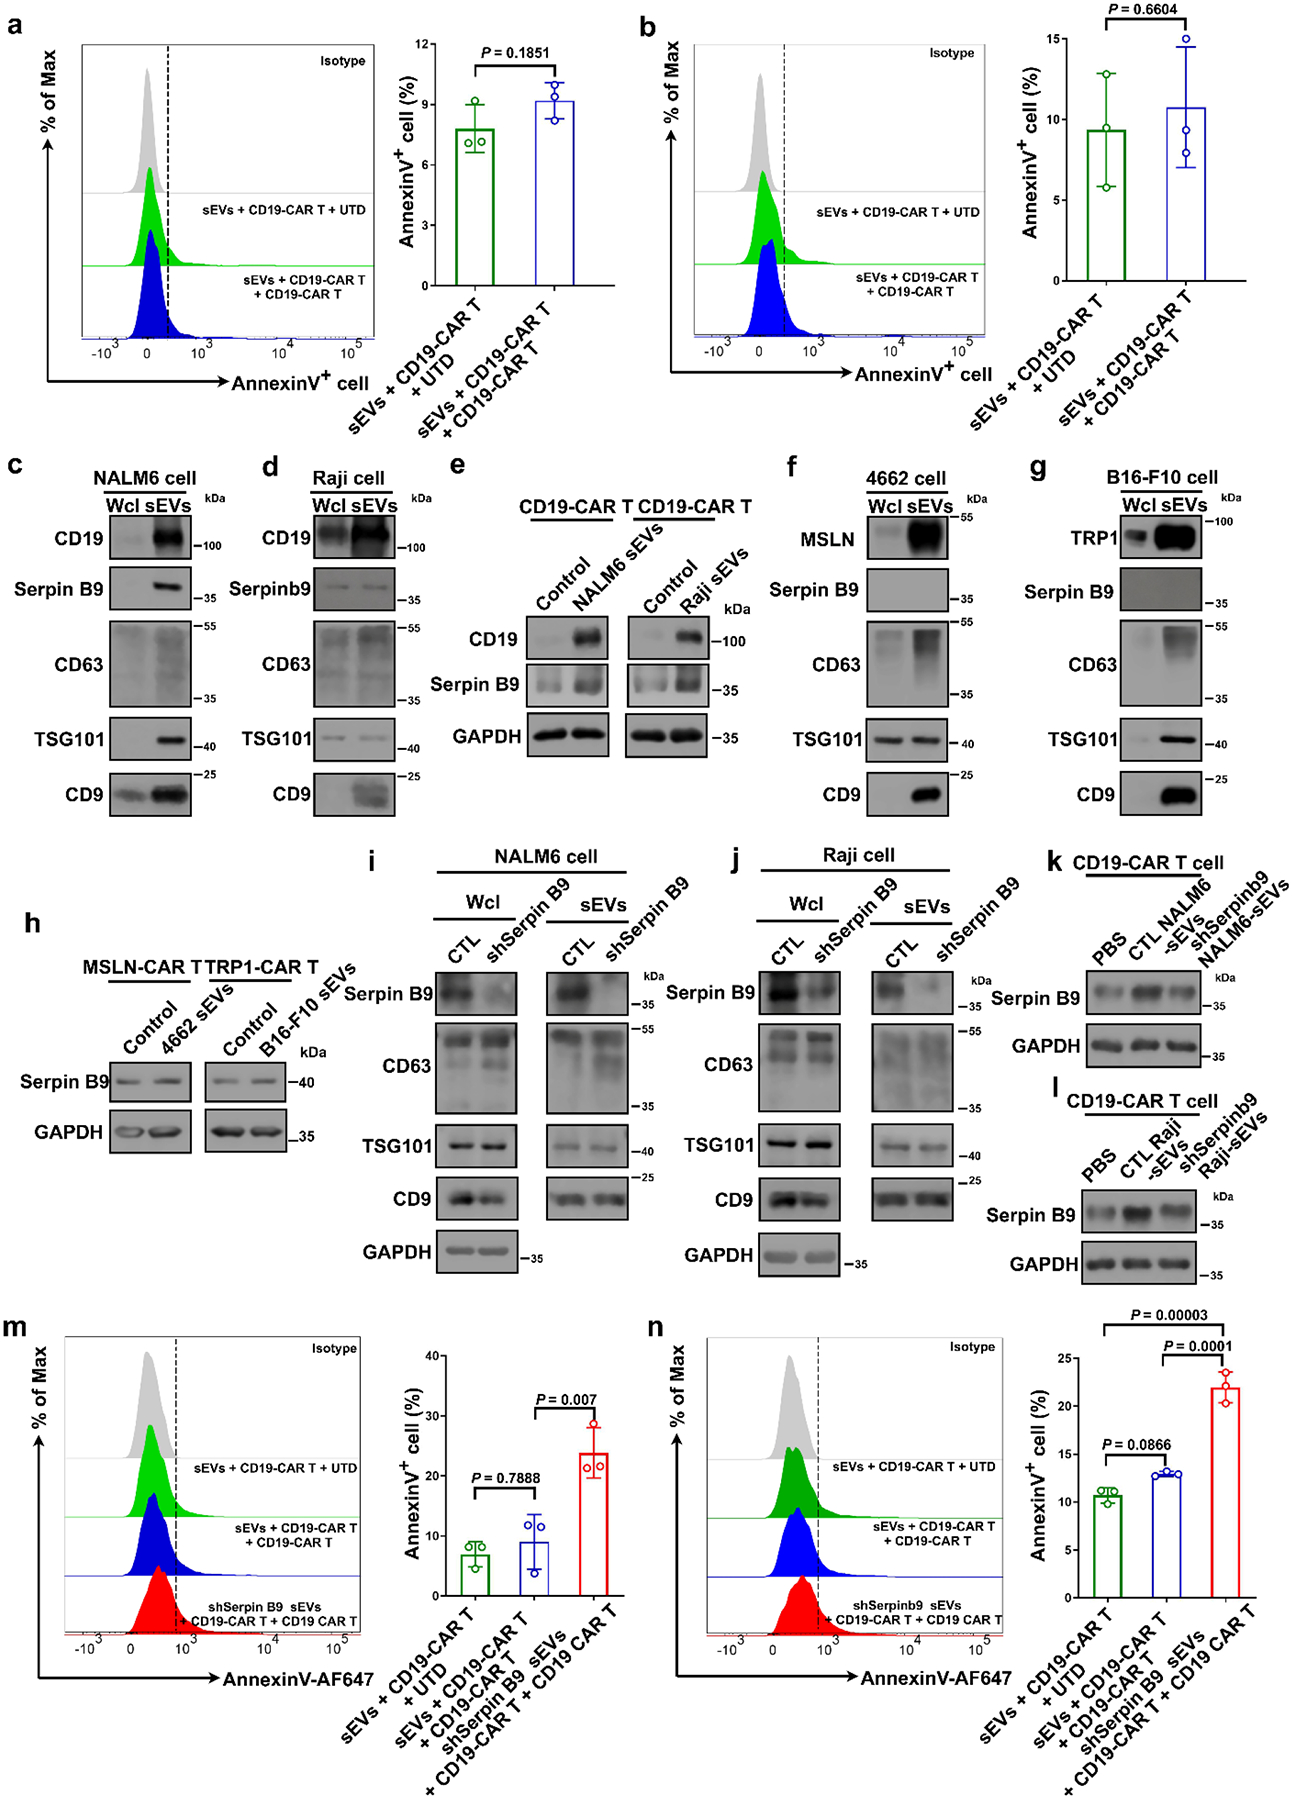
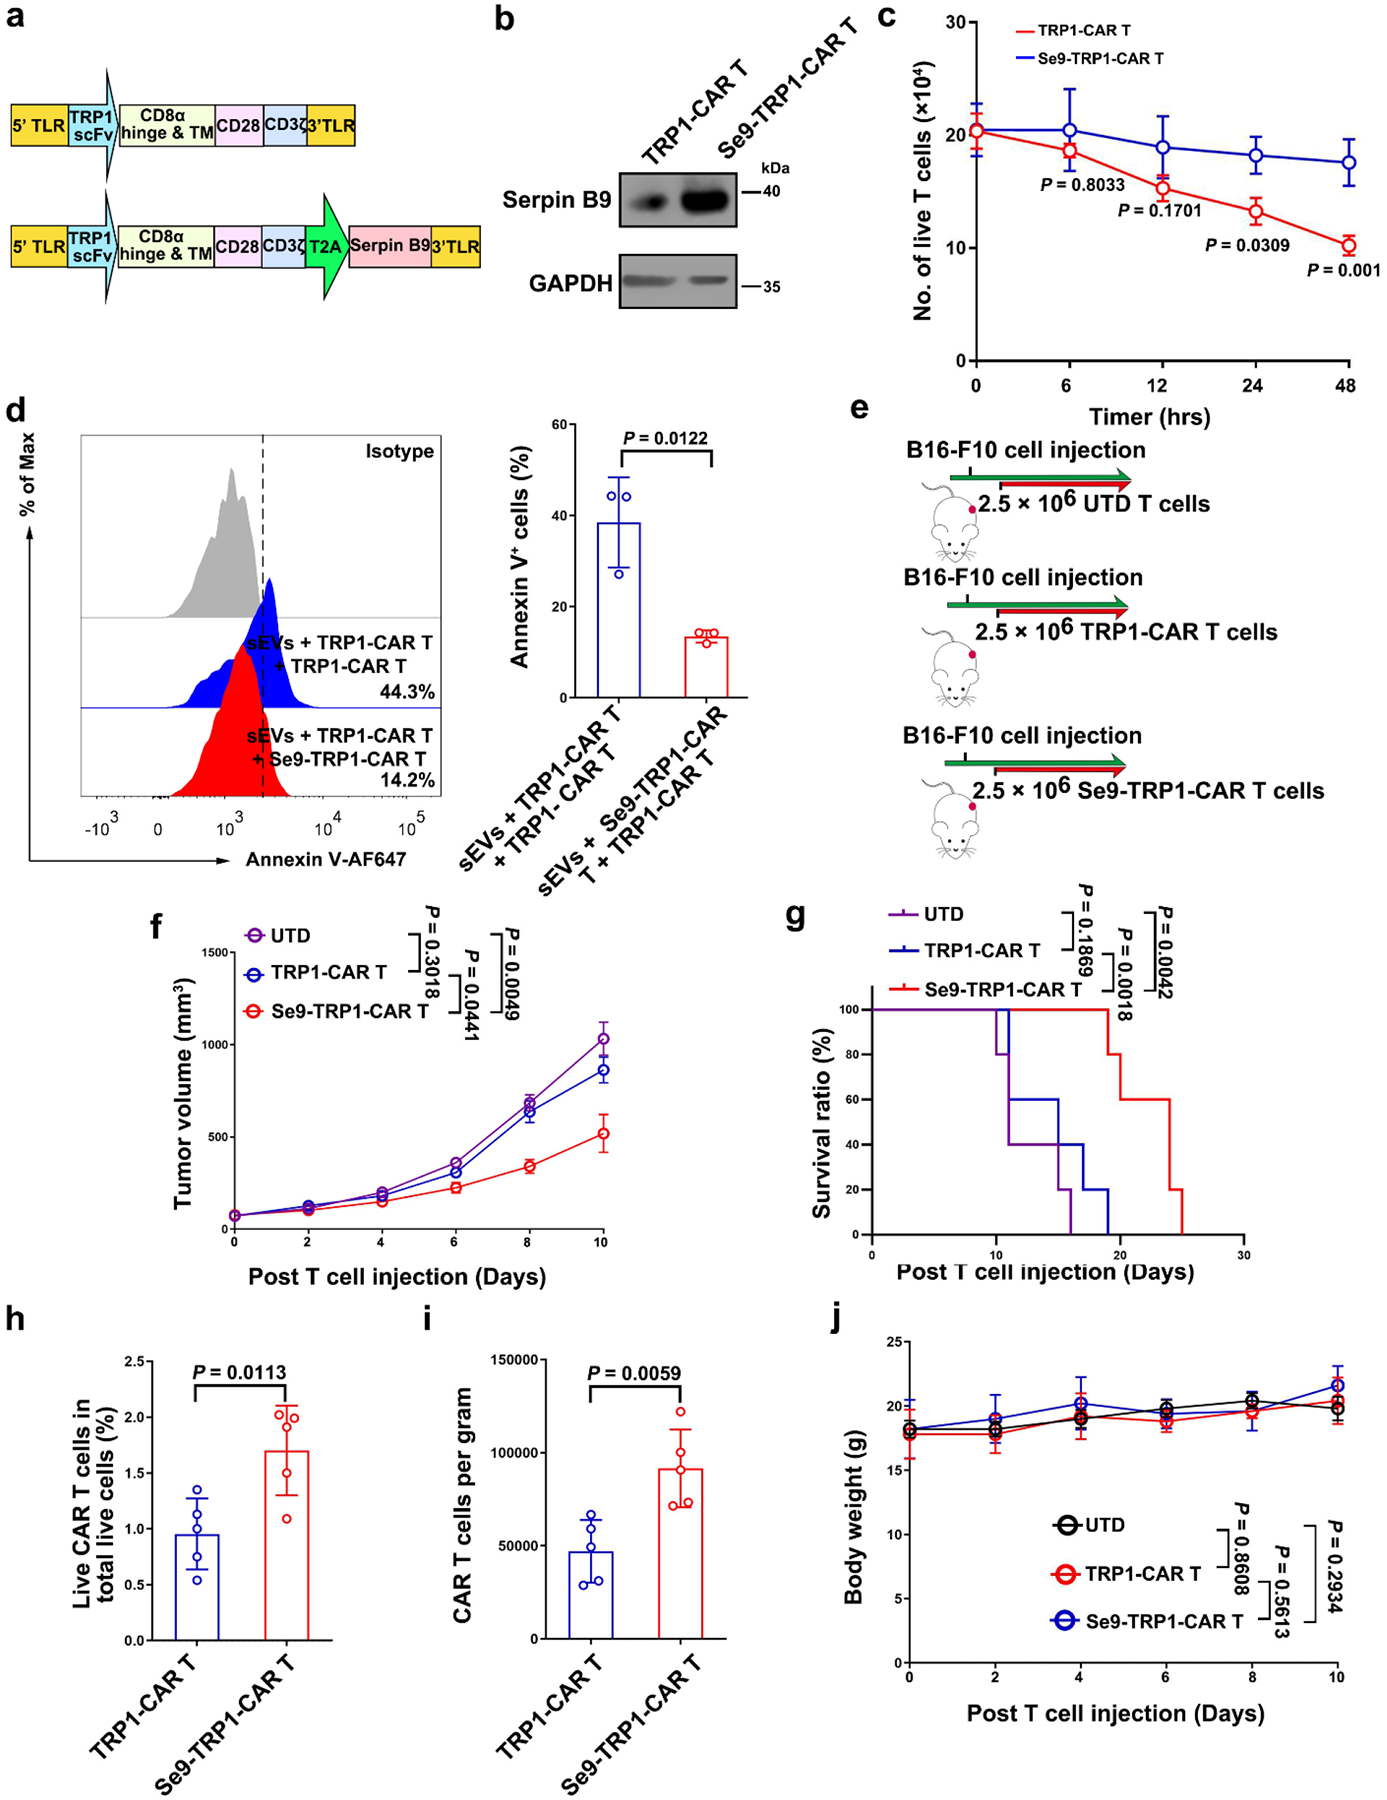
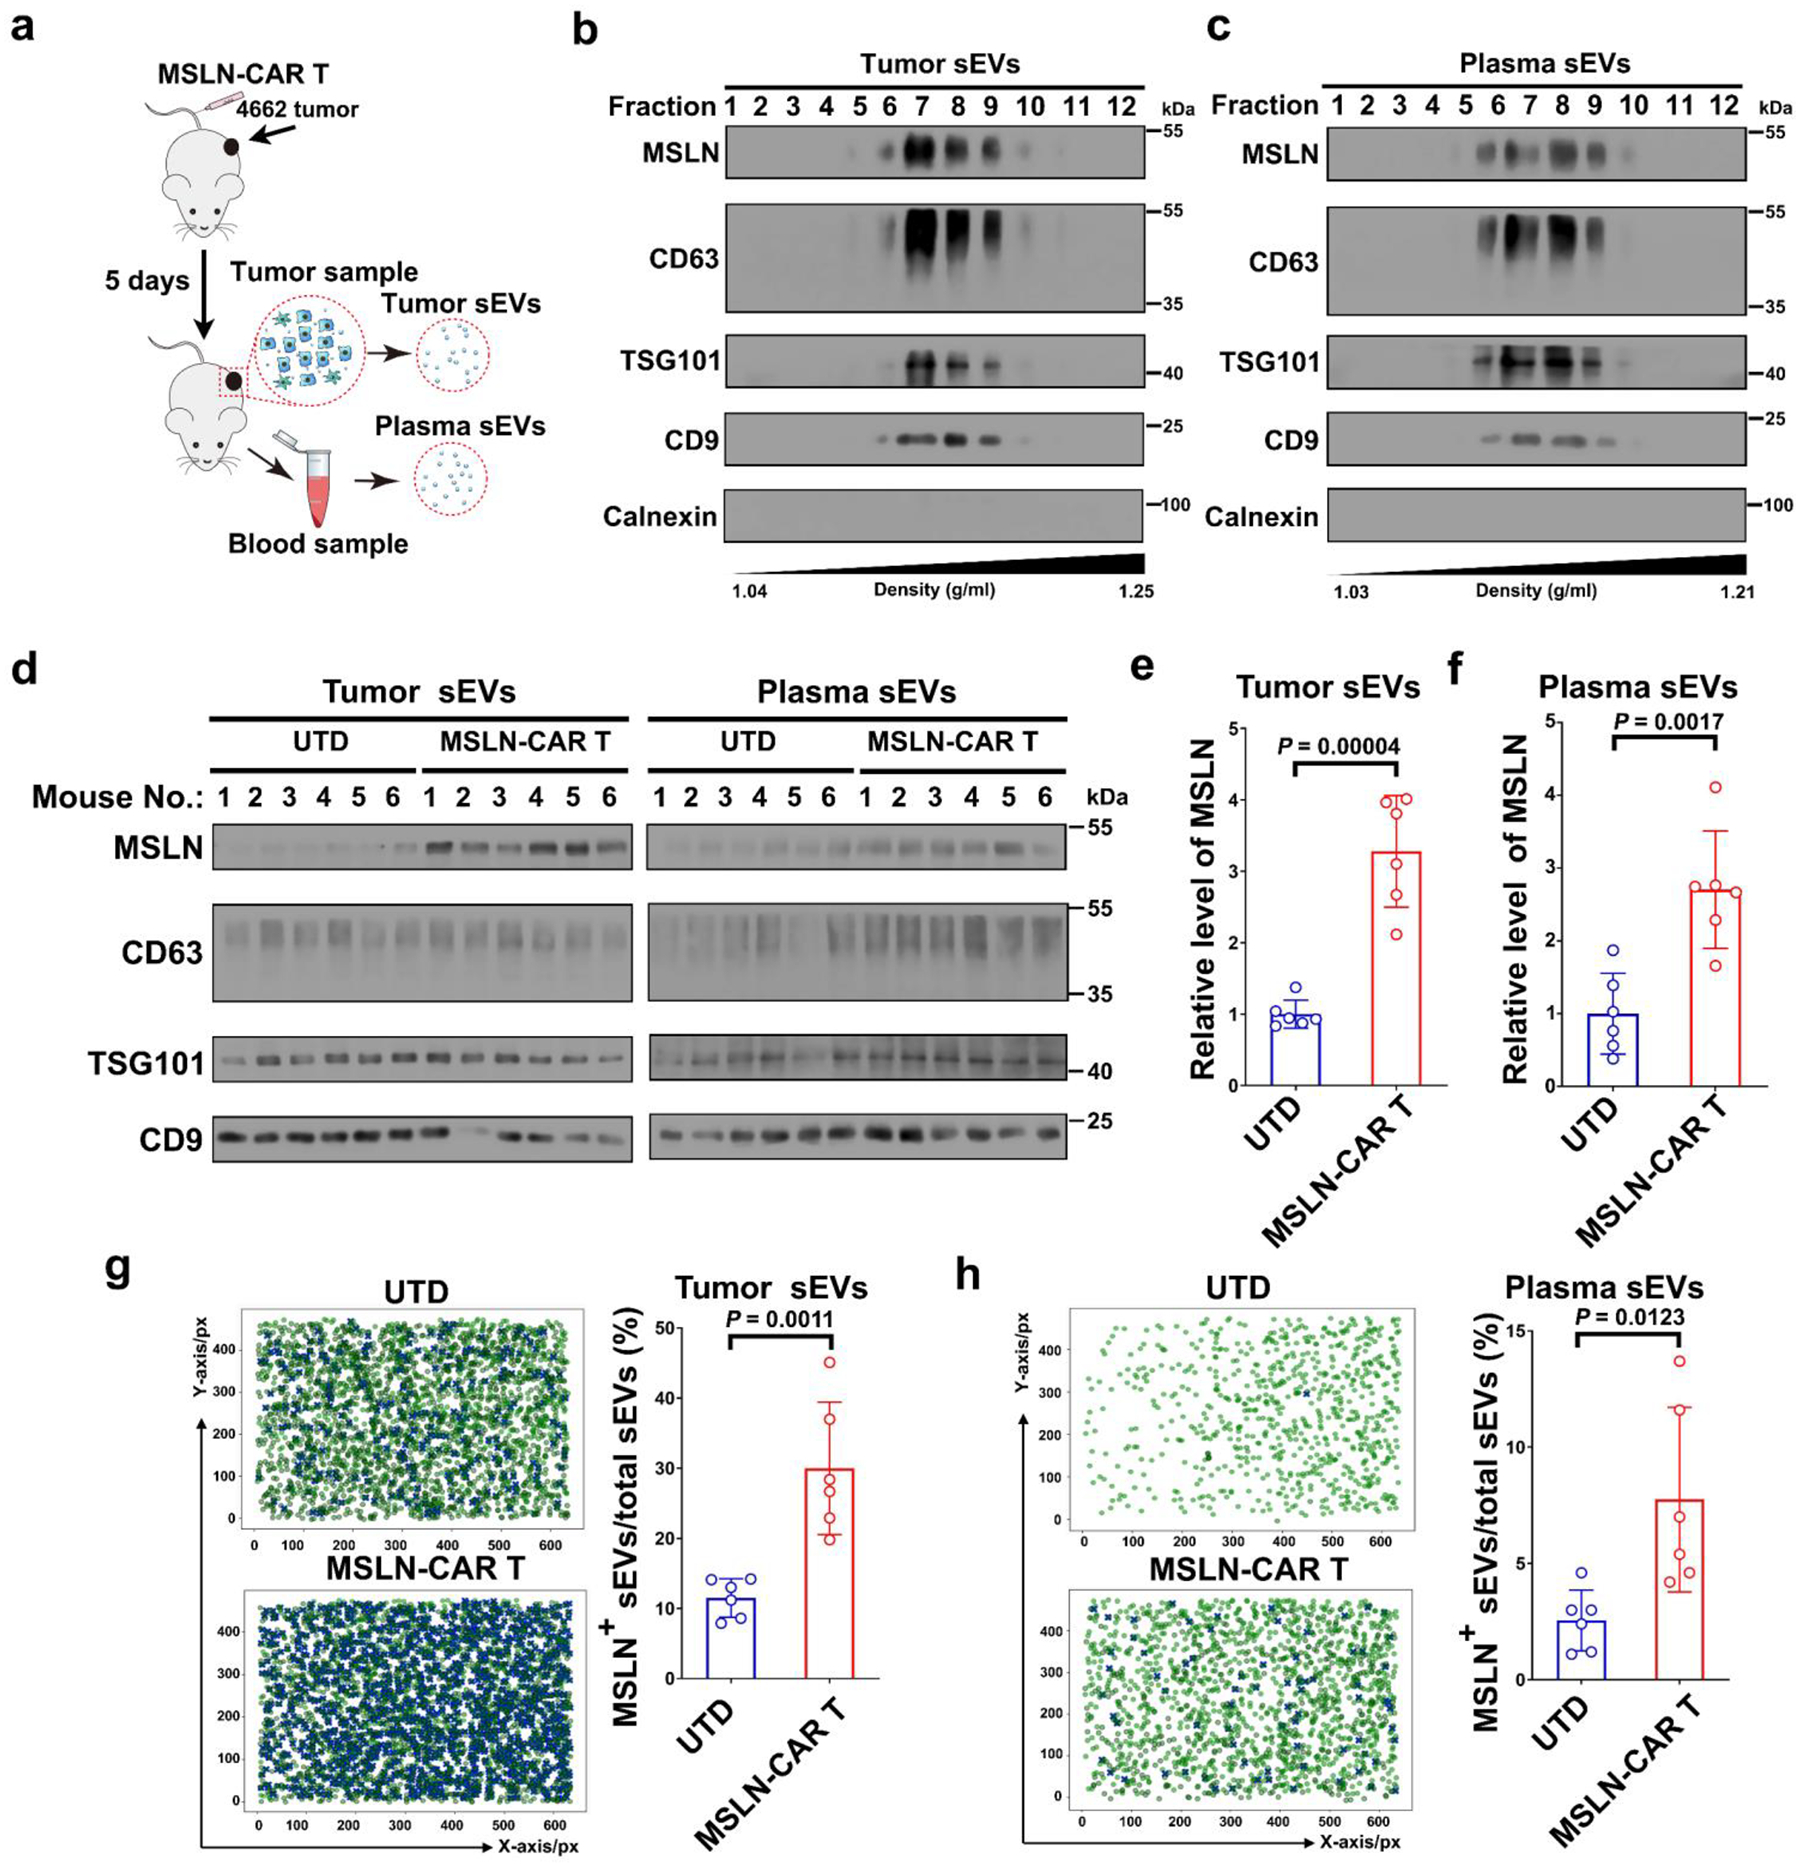
The efficacy of chimeric antigen receptor (CAR) T cells against solid tumors is limited. The molecular mechanisms underlying CAR T cell resistance are yet to be elucidated and new strategies need to be developed to improve treatment outcomes. Here we report that solid tumors respond to CAR T cells by upregulating the secretion of small extracellular vesicles carrying tumor antigens, which are horizontally transferred to CAR T cells, leading to antigen recognition and CAR T cell fratricide. Engineered CAR T cells armored with Serpin B9, a major granzyme B inhibitor, show decreased fratricide and increased vitality, tumor infiltration, and antitumor activity in female mice. Moreover, Serpin B9-armored CAR T cells show higher efficacy than parental CAR T cells in treating solid tumors when combined with the anti-programmed death 1 antibody. Our study demonstrates a mechanism that limits CAR T cell function and suggests an improved strategy in tumor treatment.


Conflict of interest statement

Competing interests: The authors declare no competing interests.

Figures

Extended Data Fig. 1|
Extended Data Fig. 1|. Increased secretion of tumor antigens via sEVs in response to CAR T cell treatment.
a, Flow cytometry showing the purity of T cells isolated from mouse spleen used in the study. Experiments consisted of three biological replicates with similar results. b, Transfection efficiency of mouse MSLN-CAR T cells. Experiments consisted of three biological replicates with similar results. c, Representative electron microscopic images of sEVs isolated from tumor tissues and plasma from mice bearing 4662 tumors. Scale bar, 100 nm. Experiments consisted of three biological replicates with similar results. d, NTA of sEVs isolated from tumor tissues from mice bearing 4662 tumors. The X-axis indicates the diameters of the isolated vesicles; the Y-axis indicates the concentration of isolated vesicles (particles/ml). Experiments consisted of six biological replicates with similar results. e, NTA of sEVs isolated from plasma of mice bearing 4662 tumors. Experiments consisted of six biological replicates with similar results. f, Western blot showing the baseline levels of MSLN in plasma sEVs in tumor-free mice and untreated 4662 tumor-bearing mice. The blot for MSLN was overexposed so that the MSLN in plasma sEVs from tumor free mice could be detected. Relative levels of MSLN on plasma sEVs were quantified and shown to the right. Six mice were used in each group. g, Transfection efficiency of mouse TRP1-CAR T cells. Experiments consisted of three biological replicates with similar results. h, TRP1 co-fractionated with exosome marker proteins (CD63, TSG101 and CD9) on iodixanol density gradients from B16-F10 tumor tissue-derived sEVs. Experiments consisted of three biological replicates with similar results. i, TRP1 co-fractionated with exosome marker proteins on iodixanol density gradients from the plasma of B16-F10 tumor bearing mice. Experiments consisted of three biological replicates with similar results. j, Western blot showing the baseline levels of TRP1 in plasma sEVs in tumor-free mice and untreated B16-F10 tumor-bearing mice. The blot for TRP1 was overexposed so that the TRP1 in plasma sEVs from tumor free mice could be detected. Relative levels of MSLN on plasma sEVs were quantified and shown to the right. Six mice were used in each group. k and l, Western blots showing TRP1 and exosome marker proteins in the sEVs isolated from B16-F10 tumor tissues (k) and plasma (l) of B16-F10 tumor bearing mice. All lanes were loaded with an equal amount of proteins. Six mice were used in each group. Quantification of TRP1 expression in sEVs is shown to the right. m and n, ZetaView analysis showing the percentage of TRP1+ sEVs derived from tumor tissues (m) or the plasma (n) of B16-F10 tumor-bearing mice with indicated treatments. In the left panel, each green dot represents a sEV, while each blue “×” represents TRP1 a positive sEV, as generated from manufacturer’s software. Quantification is shown to the right. Six mice were used in each group. o, Western blots showing MSLN and exosome marker proteins (CD63, TSG101 and CD9) in the sEVs isolated from MOC1 tumor tissues and the plasma of tumor-bearing mice. All lanes were loaded with an equal amount of proteins. Six mice were used in each group. p and q, Quantification of MSLN levels in sEVs from tumor tissues (p) and the plasma of tumor-bearing mice (q). Six mice were used in each group. Data represent mean ± SD (n=3 or indicated). Statistical analysis was performed using two-sided unpaired t-test (f, j-n, p and q).
Extended Data Fig. 2|
Extended Data Fig. 2|. The effect of CM from CAR T cells on tumor cell apoptosis and the effect of TNF-α treatment on tumor cell sEV secretion.
a, Flow cytometry showing the effect of MSLN-CAR T cell CM (fresh medium: CM from MSLN-CAR T cells = 1: 1) on the apoptosis of 4662 cells. The quantification is shown at the right. b, flow cytometry showing the effect of TRP1-CAR T cell CM (fresh medium: CM from TRP1-CAR T cells = 1: 1) on the apoptosis of B16-F10 cells. The quantification is shown at the right. c, Quantification from nanoparticle tracking analysis showing the effect of TNF-α on sEV secretion from 4662 cells. d, Quantification from NTA showing the effect of TNF-α on sEV secretion of B16-F10 cells. Experiments consisted of three biological replicates for (a-d). Data represent mean ± SD (n=3). Statistical analysis was performed using two-sided unpaired t-test (a-d).
Extended Data Fig. 3|
Extended Data Fig. 3|. Knockout of Rab27a inhibits sEV tumor antigen secretion.
a, effect of Rab27a KO on sEV secretion from 4662 cells as examined by NTA. Experiments consisted of three biological replicates. b, Western blot showing the effect of Rab27a KO on sEV MSLN secretion from 4662 cells. Quantification of MSLN is shown to the right. Experiments consisted of three biological replicates. c, effect of Rab27a KO on sEV secretion from B16-F10 cells. Experiments consisted of three biological replicates. d, Western blot showing the effect of Rab27a KO on sEV TRP1 secretion from B16-F10 cells. Quantification of TRP1 is shown to the right. Experiments consisted of three biological replicates. e, Western blots showing MSLN and CD63 in the circulating sEVs purified from the plasma of Rab27a KO 4662 tumor-bearing mice with MSLN-CAR T cell or Tnf-a KO MSLN-CAR T cell treatment. Quantification of MSLN levels in circulating sEVs from Rab27a KO 4662 tumor-bearing mice is shown to the right. Six mice were used in each group. f, Western blots showing TRP1 and exosome marker proteins in the circulating sEVs purified from the plasma of Rab27a KO B16-F10 tumor-bearing mice with TRP1-CAR T cell or Tnf-a KO TRP1-CAR T cell treatment. Quantification of MSLN levels in circulating sEVs from Rab27a KO 4662 tumor-bearing mice is shown to the right. Six mice were used in each group. Data represent mean ± SD (n=3 or 6). Statistical analysis was performed using two-sided unpaired t-test (a-f).
Extended Data Fig. 4|
Extended Data Fig. 4|. Tumor-derived sEVs transfer tumor antigens to CAR T cells.
a, Western blot showing the MSLN expression in human MSLN-CAR T cells treated with sEVs derived from EM cells and MSLN-expressing EM cells (EM-MSLN cells). Experiments consisted of three biological replicates with similar results. b, EM-MSLN cell-derived sEVs increased the percentage of MSLN-positive human MSLN-CAR T cells in a dose-dependent manner as analyzed by flow cytometry. Experiments consisted of three biological replicates. c, Western blot showing the PSMA expression in human PSMA-CAR T cells treated with sEVs derived from PC3 cells and PSMA-expressing PC3 cells (PC3-PSMA cells). Experiments consisted of three biological replicates with similar results. d, PC3-PSMA cell-derived sEVs increased the percentage of PSMA-positive human PSMA-CAR T cells in a dose-dependent manner as analyzed by flow cytometry. Experiments consisted of three biological replicates. e, Flow cytometry showing the PSMA expression on the surface of human PSMA-CAR T cells with or without sEVs from PC3-PSMA cells or PC3 cells. The percentages of PSMA-positive CAR T cells under indicated treatments are shown at the right. Experiments consisted of three biological replicates. f, Western blot showing the HER2 expression in human HER2-CAR T cells treated with sEVs derived from SKOV3 cells with or without HER2 knockout. Experiments consisted of three biological replicates with similar results. g, SKOV3 cell-derived sEVs increased the percentage of HER2-positive human HER2-CAR T cells in a dose-dependent manner as analyzed by flow cytometry. Experiments consisted of three biological replicates. h, Flow cytometry showing the HER2 expression on the surface of human HER2-CAR T cells with sEVs from SKOV3 cells or HER2 KO SKOV3 cells. The percentages of HER2-positive CAR T cells under indicated treatments are shown at the right. Experiments consisted of three biological replicates. i, Western blot showing treatment with 4662 cell-derived sEVs increased the level of MSLN in murine MSLN-CAR T cells in a dose-dependent manner. GAPDH was used as loading control. Experiments consisted of three biological replicates with similar results. j, 4662 cell-derived sEVs increased the percentage of MSLN-positive murine MSLN-CAR T cells as analyzed by flow cytometry. Experiments consisted of three biological replicates. k, Western blot showing MOC1 cell-derived sEVs increased the level of MSLN in murine MSLN-CAR T cells. Experiments consisted of three biological replicates with similar results. l, MOC1 cell-derived sEVs increased the percentage of MSLN-positive in murine MSLN-CAR T cells as analyzed by flow cytometry. Experiments consisted of three biological replicates. m, Western blot showing the MSLN expression in murine MSLN-CAR T cells with or without sEVs derived from MOC1 or Msln KO MOC1 cells. Experiments consisted of three biological replicates with similar results. n, The percentage of MSLN-positive murine MSLN-CAR T cells with or without sEVs from MOC1 or Msln KO MOC1 cells as analyzed by flow cytometry. Experiments consisted of three biological replicates. o, Flow cytometry showing the percentage of MSLN+ MSLN-CAR T cell or TRP1-CAR T cells after 4662 sEV treatment. Experiments consisted of three biological replicates. p, Flow cytometry showing the percentage of TRP1+ TRP1-CAR T cell or MSLN-CAR T cells after B16-F10 sEV treatment. Experiments consisted of three biological replicates. q, Western blot showing B16-F10 cell-derived sEVs increased the level of TRP1 in TRP1-CAR T cells in a dose-dependent manner. Experiments consisted of three biological replicates with similar results. r, B16-F10 cell-derived sEV treatment increased the percentage of TRP1-positive TRP1-CAR T cells as analyzed by flow cytometry. Experiments consisted of three biological replicates. s, Western blot showing the TRP1 expression in TRP1-CAR T cells after treatment with sEVs from B16-F10 cells or Trp1 KO B16-F10 cells. Experiments consisted of three replicates with similar results. t, Flow cytometry showing the TRP1 expression on the surface of TRP1-CAR T cells with or without treatment of sEVs from B16-F10 cells or Trp1 KO B16-F10 cells. Quantification of TRP1+ CAR T cells with indicated treatment is shown to the right. Experiments consisted of three biological replicates. u, Schema of C57BL/6 mice bearing wide type or Rab27a KO B16-F10 tumors with indicated treatments after tumors reach ~150 mm3. Five mice were used in each group. v, Flow cytometry showing TRP1 expression on the surface of TRP1-CAR T cells in B16-F10 or Rab27a KO B16-F10 tumors from C57BL/6 mice with indicated treatments. Quantification of TRP1+ CAR T cells with indicated treatments is shown to the right. Five mice were used in each group. (n=5). Data represent mean ± SD (n = 3 or indicated). Statistical analysis is performed using one-way ANOVA with Sidak’s multiple comparison tests (b, d, g, j, l, r and v), one-way ANOVA with Dunnett’s multiple comparison tests (e, h, n and t), or using two-sided unpaired t-test (o, p).
Extended Data Fig. 5|
Extended Data Fig. 5|. sEV-mediated tumor antigen transfer led to CAR T cell fratricide.
a, Representative images of flow cytometric analysis showing the expression of exhaustion markers (LAG3, TIM3 and PD-1) in MSLN-CAR T cells with or without 4662 cell-derived sEV treatment after 24 hrs (upper panel). Quantification of the flow cytometric analysis showing that 4662 cell-derived sEVs had no significant influence on the expression of MSLN-CAR T cell exhaustion markers (lower panel). b, Representative images of flow cytometric analysis showing the expression of exhaustion markers (LAG3, TIM3, and PD-1) in TRP1-CAR T cells with or without treatment with B16-F10 cell-derived sEVs (upper panel). The quantification of the flow cytometric analysis showing that B16-F10 cell-derived sEVs had no significant influence on TRP1-CAR T cell exhaustion markers (lower panel). c, The effect of MOC1 cell-derived sEVs on the viability of MSLN-CAR T cells over time. d, The effect of MOC1 cell-derived sEVs with indicated treatments on the viability of MSLN-CAR T cells. e, Flow cytometry showing the killing of MOC1 cell- or Msln KO MOC1 cell-derived sEV treated MSLN-CAR T cells by fresh MSLN-CAR T cells. Apoptosis of MSLN-CAR T cells detected by flow cytometry analysis of Annexin V (left panel), and the percentage of apoptotic MSLN-CAR T cells is calculated (right panel). f, The effect of EM-MSLN cell-derived sEVs on the viability of human MSLN-CAR T cells over time. g, The effect of EM-MSLN cell-derived sEVs with indicated treatments on the viability of human MSLN-CAR T cells. h, Flow cytometry showing the killing of tumor cell-derived sEV treated human MSLN-CAR T cells by fresh human MSLN-CAR T cells. Apoptosis of MSLN-CAR T cells detected by flow cytometry analysis of Annexin V (left panel), and the percentage of apoptotic MSLN-CAR T cells is calculated (right panel). i, The effect of PC3-PSMA cell-derived sEVs on the viability of PSMA-CAR T cells over time. j, The effect of PC3-PSMA cell-derived sEVs with indicated treatments on the viability of PSMA-CAR T cells. k, Flow cytometry showing the killing of PC3-PSMA cell- or PC3 cell-derived sEV treated PSMA-CAR T cells by fresh PSMA-CAR T cells. Apoptosis of PSMA-CAR T cells detected by flow cytometry analysis of Annexin V (left panel), and the percentage of apoptotic PSMA-CAR T cells is calculated (right panel). l, The effect of SKOV3 cell-derived EVs on the viability of HER2-CAR T cells over time. m, The effect of SKOV3 cell-derived sEVs with indicated treatments on the viability of HER2-CAR T cells. n, Flow cytometry showing the killing of SKOV3 cell- or HER2 KO SKOV3 cell-derived sEV treated HER2-CAR T cells by fresh HER2-CAR T cells. Apoptosis of HER2-CAR T cells detected by flow cytometry analysis of Annexin V (left panel), and the percentage of apoptotic HER2-CAR T cells is calculated (right panel). o, The effect of B16-F10-CD19 cell-derived sEVs on the viability of human CD19-CAR T cells over time. p, The effect of B16-F10 or B16-F10-CD19 cell-derived sEVs with indicated treatments on the viability of human CD19-CAR T cells. q, Flow cytometry showing the killing of B16-F10 cell- or B16-F10-CD19 cell-derived sEV treated CD19-CAR T cells by fresh human CD19-CAR T cells. Apoptosis of human CD19-CAR T cells detected by flow cytometry analysis of Annexin V (left panel), and the percentage of apoptotic CD19-CAR T cells is calculated (right panel). Experiments consisted of three biological replicates for a-q. r, Representative IHC images showing the levels of cleaved-caspase 3 in 4662 tumors or 4662 tumors with Rab27a KO, with or without indicated sEV treatments. Cell nuclei were stained with hematoxylin (blue). Cleaved-caspase 3 was stained with primary and secondary antibodies followed by DAB (brown). Scale bar: 100 μm. The quantification is shown at the right. Five mice were used in each group. s, The number of CD45+ immune cells in 4662 tumors for each group of mice quantified based on flow cytometry analysis. Five mice were used in each group. t, Representative IHC images showing the levels of cleaved-caspase 3 in B16-F10 tumors or B16-F10 tumors with Rab27a KO, with or without indicated sEV treatments. Scale bar: 100 μm. The quantification is shown at the right. Five mice were used in each group. u, The number of CD45+ immune cells in B16-F10 tumors for each group of mice quantified based on flow cytometry analysis. Five mice were used in each group. Data represent mean ± SD (n = 3 or indicated). Statistical analysis is performed using two-sided unpaired t-test (a-c, f, i, l and o), one-way ANOVA with Sidak’s multiple comparison tests (d, g, j, m, r-u) or one-way ANOVA with Dunnett’s multiple comparison tests (e, h, k, n, p and q).
Extended Data Fig. 6|
Extended Data Fig. 6|. The effect of leukemia cell sEVs on CD19-CAR T cell fratricide.
a and b, Flow cytometry analysis showing no significant effect of NALM6 cell (a) or Raji cell (b) derived sEVs on CD19-CAR T cell fratricide. c and d. Western blots showing the presence of CD19 and Serpin B9 in the whole cell lysates (Wcl) and the sEVs from NALM6 (c) and Raji cells (d). e, Western blots showing that sEVs from NALM6 cells or Raji cells increased the expression of CD19 and Serpin B9 in CD19-CAR T cells. f and g, Western blots showing Serpin B9 was barely detectable in the Wcl and the sEVs from 4662 cells (f) and B16-F10 cells (g). h, Western blots showing that sEVs from 4662 cells or B16-F10 cells had no significant effect on the levels of Serpin B9 in MSLN-CAR T cells or TRP1-CAR T cells. i and j, Western blots showing the knockdown of Serpin B9 in NALM6 cells (i) and Raji cells (j) and their sEVs. k and l, Western blots showing Serpin B9 knockdown attenuated the NALM6 cell (k) and Raji cell (l) sEV-mediated Serpin B9 expression in CD19-CAR T cells. Experiments consisted of three biological replicates with similar results for c-l. m and n, Flow cytometry analysis showing that sEVs from Serpin B9 knockdown NALM6 cells (m) or Raji cells (n) enhanced CAR T cell fratricide. Experiments consisted of three biological replicates for m and n. Data represent mean ± SD (n=3). Statistical analysis was performed using two-sided unpaired t test (a and b), or using one-way ANOVA with Dunnett’s multiple comparison tests (m and n).
Extended Data Fig. 7|
Extended Data Fig. 7|. Serpin B9-armored MSLN-CAR T cells show increased tumor cell killing.
a, Western blot showing the expression of endogenous Serpin B9 and EGFP-Serpin B9 in MSLN-CAR T and Se9-MSLN-CAR T cells using the anti-Serpin B9 antibody. The second-generation anti-MSLN CAR retroviral construct, which included EGFP reporter was used in this study (see “Methods”). Experiments consisted of three biological replicates with similar results. b, Flow cytometric analysis showing the transfection efficiency of mouse MSLN-CAR T cells and Se9-MSLN-CAR T cells. Experiments consisted of three biological replicates. c, Se9-MSLN-CAR T cells showed stronger killing of 4662 cells compared to MSLN-CAR T cells. Experiments consisted of three biological replicates. d, Growth curves of tumors in mice with UTD T, MSLN-CAR T and Se9-MSLN-CAR T treatments, respectively (n=5). e, MSLN-CAR T or Se9-MSLN-CAR T cell treatment did not show a significant difference in the body weights of 4662 tumor-bearing mice (n=5). Data represent mean ± SD (n=3 or indicated). Statistical analysis was performed using two-sided unpaired t-tests (b, c) or one-way ANOVA with Dunnett’s multiple comparison tests (e).
Extended Data Fig. 8|
Extended Data Fig. 8|. Serpin B9 armoring inhibits CAR T cell fratricide and increases the function of CAR T cells.
a, Design of TRP1-CAR and Se9-TRP1-CAR. b, Western blots showing the expression of Serpin B9 in TRP1-CAR T cells and Se9-TRP1-CAR T cells. Experiments consisted of three biological replicates with similar results. c, Effect of B16-F10 cell-derived sEVs on the viability of TRP1-CAR T cells and Se9-TRP1-CAR T cells over time. Experiments consisted of three biological replicates. d, Flow cytometry showing the killing of TRP1-CAR T cells and Se9-TRP1-CAR T cells by fresh TRP1-CAR T cells. Apoptosis of TRP1-CAR T cells or Se9-TRP1-CAR T cells is detected by flow cytometry analysis of Annexin V (left panel), and the percentage of apoptotic CAR T cells is calculated (right panel). Experiments consisted of three biological replicates. e, Schema of C57BL/6 mice bearing B16-F10 tumors treated with indicated T cells. f, Growth curves of tumors in mice with indicated treatments (n=5). g, Survival curves of mice with indicated treatments (n=5). h, Percentage of live TRP1-CAR T cells or Se9-TRP1-CAR T cells in total live cells from B16-F10 tumors with indicated treatments as quantified from flow cytometry analysis (n=5). i, The number of TRP1-CAR T cells or Se9-TRP1-CAR T in tumors for each group of mice quantified based on flow cytometry analysis (n=5). j, TRP1-CAR T or Se9-TRP1-CAR T cells did not result in a significant difference in the body weights of B16-F10 tumor-bearing mice (n=5). Data represent mean ± SD (n=3 or indicated). Statistical analysis was performed using two-sided unpaired t-tests (c, d, i, j), one-way ANOVA with Dunnett’s multiple comparison tests (f, j) or log-rank tests (g).
Extended Data Fig. 9|
Extended Data Fig. 9|. Treatment of 4662 tumors by the Se9-MSLN-CAR T cells and anti-PD-1 combination.
a, Growth curves of 4662 tumors in mice with indicated treatments. b, Growth curves of 4662 tumors in mice with indicated treatments. c, Body weight of 4662 tumor bearing mice with indicated treatments. Data represent mean ± SD (n = 7). Statistical analysis is performed using Welch ANOVA with Dunnett T3 multiple comparison tests (a, c).
Extended Data Fig. 10|
Extended Data Fig. 10|. Treatment of B16-F10 tumors by the Se9-TRP1-CAR T cell and anti-PD-1 combination.
a, Treatment with anti-PD-1 antibody or TRP1-CAR T cells alone had no inhibitory effect on the growth of B16-F10 tumors. b, Growth curves of B16-F10 tumors in mice with indicated treatments. c, B16-F10 tumor weights with indicated treatments. d, Survival curves of mice with indicated treatments. e, The number of TRP1-CAR T cells or Se9-TRP1-CAR T cells in tumors for each group of mice quantified based on flow cytometry analysis. f, The percentage of live TRP1-CAR T cells or Se9-TRP1-CAR T cells in total live cells from B16-F10 tumors with indicated treatment as quantified from flow cytometry analysis. g, The percentage of GzmB+ TRP1-CAR T cells as quantified by flow cytometry. h, The percentage of Ki-67+ TRP1-CAR T cells as quantified by flow cytometry. i, The combination of Se9-TRP1-CAR T cell with anti-PD-1 antibody showed no significant effect on the body weight of B16-F10 tumor-bearing mice. Data represent mean ± SD (n = 7). Statistical analysis was performed using Welch ANOVA with Dunnett T3 multiple comparison tests (a-c, e-i), or log-rank tests (d).
Fig. 1 |
Fig. 1 |. Increased secretion of PDAC 4663 tumor antigens via sEVs in response to CAR T cells.
a, Schema of C57BL/6 mice with 4662 tumors treated with MSLN-CAR T cells. See Methods for details. Six mice were used in each group. b, MSLN co-fractionated with exosome marker proteins (CD63, TSG101 and CD9) on density gradients from 4662 tumor tissue-derived sEVs. The endoplasmic reticulum protein Calnexin was used as a negative control for sEVs. Experiments consisted of three biologically independent samples with similar results. c, MSLN co-fractionated with CD63, TSG101 and CD9 on density gradients from the plasma sEVs of mice bearing 4662 tumors. Experiments consisted of three biologically independent samples with similar results. d, Western blots showing MSLN and exosome marker proteins in the purified sEVs from tumor tissues and the plasma of tumor-bearing mice treated with MSLN-CAR T cells vs. untransduced (UTD) T cells. All lanes were loaded with an equal amount of sEV proteins. Six mice were used in each group. e and f, Quantification of MSLN levels in sEVs from tumor tissues (e) and the plasma of tumor-bearing mice (f). g and h, Nanoparticle tracking analysis (NTA) using ZetaView showing the percentage of MSLN+ sEVs in total sEVs derived from tumor tissues (g) or the plasma of tumor-bearing mice (h) with indicated treatments. In the left panel, each green dot represents an sEV, while each blue “×” represents a MSLN+ sEV, as generated by manufacturer’s software. Quantification of the results is shown to the right. Six mice were used in each group. Data represent mean ± SD (n=3 or indicated). Statistical analysis was performed using two-sided unpaired t-test (e-h).
Fig. 2 |
Fig. 2 |. CAR T cell-derived TNF-α promotes the secretion of sEVs and the activation of Rab27a in tumor cells in vitro.
a, GO enrichment analysis showing the genes enriched in 4662 cells treated with the CM from MSLN-CAR T cells compared to those treated with CM from UTD T cells. MSLN-CAR T cells and UTD T cells were cultured in the mouse MSLN protein-coated 96-well plate for 48 hrs before the supernatant was collected. See Methods for details. Experiments consisted of three biologically independent samples. b, JFC1 pull-down assay showing the level of GTP-Rab27a in 4662 and B16-F10 cells with indicated treatments. The inputs of total Rab27a are shown in the upper panel. GAPDH is used as a loading control. Experiments consisted of three biologically independent samples with similar results. c, Fold changes of the levels of GTP-Rab27a in 4662 cells with indicated treatments. d, Fold changes of the levels of GTP-Rab27a in B16-F10 cells with indicated treatments. e, JFC1 pull-down assay showing the level of GTP-Rab27a in 4662 and B16-F10 cells with indicated treatments. Experiments consisted of three biologically independent samples with similar results. f, Fold changes of the levels of GTP-Rab27a in 4662 cells with indicated treatments. g, Fold changes of the levels of GTP-Rab27a in B16-F10 cells with indicated treatments. h, NTA analysis of sEV secretion from 4662 cells with indicated treatments. i, NTA analysis of sEV secretion in B16-F10 cells with indicated treatments. j, NTA showing sEV secretion in 4662 cells with indicated treatments. k, NTA analysis of sEV secretion in B16-F10 cells with indicated treatment. Experiments consisted of three biologically independent samples for h-k. Data represent mean ± SD (n = 3). Statistical analysis is performed using one-way ANOVA with Dunnett’s multiple comparison tests (c, d, f-k).
Fig. 3 |
Fig. 3 |. CAR T cell-derived TNF-α promotes the activation of Rab27a and sEV secretion in tumor cells in vivo.
a, JFC1 pull-down assay showing the level of GTP-Rab27a in tdTomato-expressing 4662 tumors with indicated treatments. All lanes were loaded with an equal amount of protein. tdTomato was used as the internal control for the protein from tumor cells in the tumor tissues. Four mice were used in each group. Fold changes of the levels of GTP-Rab27a in 4662 tumors with indicated treatments is shown to the right. b, JFC1 pull-down assay showing the levels of GTP-Rab27a in EGFP-expressing B16-F10 tumors with indicated treatments. All lanes were loaded with an equal amount of proteins. EGFP was used as the internal control for the protein from tumor cells. Four mice were used in each group. Fold changes of the levels of GTP-Rab27a in B16-F10 tumors with indicated treatments is shown to the right. c, Western blots showing MSLN and exosome marker proteins in the circulating sEVs purified from the plasma of 4662 tumor-bearing mice. Quantification of MSLN levels in circulating sEVs from 4662 tumor-bearing mice is shown to the right. Six mice were used in each group. d, ZetaView analysis showing the percentage of MSLN+ sEVs in total sEVs derived from the plasma of 4662 tumor-bearing mice treated with MSLN-CAR T cells with or without Tnf-a KO. Quantification of the percentage of MSLN + sEVs in total sEVs in circulating sEVs from 4662 tumor-bearing mice is shown to the right. Six mice were used in each group. e, Western blot showing TRP1 and exosome marker proteins in the circulating sEVs purified from the plasma of B16-F10 tumor-bearing mice. Quantification of TRP1 levels in circulating sEVs from B16-F10 tumor-bearing mice is shown to the right. Six mice were used in each group. f, ZetaView analysis showing the percentage of TRP1+ sEVs in total sEVs derived from the plasma of B16-F10 tumor-bearing mice treated with TRP1-CAR T cells with or without Tnf-a KO. Quantification of the percentage of TRP1+ sEVs in total sEVs in circulating sEVs from B16-F10 tumor-bearing mice is shown to the right. Six mice were used in each group. Data represent mean ± SD (n = 4 or indicated). Statistical analysis is performed using one-way ANOVA with Dunnett’s multiple comparison tests (a, b) and two-sided unpaired t test (c-f).
Fig. 4 |
Fig. 4 |. Tumor-derived sEVs mediate the transfer of tumor antigens to CAR T cells.
a, Western blot showing the MSLN expression in human MSLN-CAR T cells treated with sEVs derived from EM cells and MSLN-expressing EM cells (EM-MSLN cells), respectively. Experiments consisted of three biologically independent samples with similar results. b, Flow cytometry showing the MSLN expression on the surface of human MSLN-CAR T cells with or without sEVs from EM-MSLN cells or EM cells. The percentages of MSLN-positive CAR T cells with indicated treatments are show at the right. Experiments consisted of three biologically independent samples. c, Western blot showing the MSLN levels in murine MSLN-CAR T cells with the treatment of sEVs from 4662 cells or Msln KO 4662 cells. Experiments consist of three replicates with similar results. d, Flow cytometry showing the MSLN levels on the surface of murine MSLN-CAR T cells after treatment with sEVs from 4662 cells or MSLN KO 4662 cells. Quantification of MSLN+ CAR T cells with indicated treatments is shown to the right. Experiments consisted of three biologically independent samples. e, Schema of C57BL/6 mice bearing wide type or Rab27a KO 4662 tumors with indicated treatments. See Methods for details. f, Flow cytometry showing the MSLN expression on the surface of murine MSLN-CAR T cells in 4662 and Rab27a KO 4662 tumors from C57BL/6 mice with different sEV treatment. Quantification of MSLN+ CAR T cells with indicated treatments is shown to the right. Five mice were used in each group. Data represent mean ± SD (n = 3 or indicated). Statistical analysis is performed using one-way ANOVA with Dunnett’s multiple comparison tests (b and d), or one-way ANOVA with Sidak’s multiple comparison tests (f).
Fig. 5 |
Fig. 5 |. sEV-mediated tumor antigen transfer led to CAR T cell fratricide.
a, The effect of 4662 cell-derived EVs on the viability of MSLN-CAR T cells and the UTD T cells. Experiments consisted of three biologically independent samples. b, The effect of B16-F10 cell-derived EVs on the viability of TRP1-CAR T cells and the UTD T cells. Experiments consisted of three biologically independent samples. c, The effect of 4662 cell-derived EVs with indicated blocking antibody treatments on the viability of MSLN-CAR T cells. Experiments consisted of three biologically independent samples. d, The effect of B16-F10 cell-derived EVs with indicated blocking antibody treatments on the viability of TRP1-CAR T cells. Experiments consisted of three biologically independent samples. e, Flow cytometry showing the killing of 4662 cell- or Msln KO 4662 cell-derived sEV treated MSLN-CAR T cells by fresh MSLN-CAR T cells. Apoptosis of MSLN-CAR T cells detected by flow cytometry analysis of Annexin V expression (left panel), and the percentage of apoptotic MSLN-CAR T cells is calculated (right panel). Experiments consisted of three biologically independent samples. f, Flow cytometry showing the killing of MSLN-CAR T cells treated with 4662 cell-derived sEVs with or without IgG or anti-MSLN antibodies, by fresh MSLN-CAR T cells. Apoptosis of MSLN-CAR T cells was examined by flow cytometry (left panel), and the percentage of apoptotic MSLN-CAR T cells was calculated (right panel). Experiments consisted of three biologically independent samples. g, Flow cytometry showing the killing of B16-F10 cell- or Trp1 KO B16-F10 cell-derived sEV treated TRP1-CAR T cells by fresh TRP1-CAR T cells. Apoptosis of TRP1-CAR T cells was examined by flow cytometry (left panel), and the percentage of apoptotic TRP1-CAR T cells is calculated (right panel). Experiments consisted of three biologically independent samples. h, Flow cytometry showing the killing of TRP1-CAR T cells treated with B16-F10 cell-derived sEVs with or without IgG or anti-TRP1 antibody, by fresh TRP1-CAR T cells. Apoptosis of TRP1-CAR T cells was examined by flow cytometry (left panel), and the percentage of apoptotic TRP1-CAR T cells is calculated (right panel). Experiments consisted of three biologically independent samples. i, Schema of C57BL/6 mice bearing wide type or Rab27a KO 4662 tumors with indicated treatments. Five mice were used in each group in this animal study. j, The percentage of live MSLN-CAR T cells in total live cells from tumors for each group of 4662 tumor-bearing mice with indicated treatments was quantified from flow cytometry analysis. Five mice were used in each group. k, Schema of C57BL/6 mice bearing wide type or Rab27a KO B16-F10 tumors with indicated treatments. Five mice were used in each group. l, The percentage of live TRP1-CAR T cells in total live cells from tumors for each group of B16-F10 tumor-bearing mice with indicated treatments was quantified. Five mice were used in each group. Data represent mean ± SD (n = 3 or indicated). Statistical analysis is performed using is performed using two-sided unpaired t test (a and b), one-way ANOVA with Sidak’s multiple comparison tests (c, d, j and l) or one-way ANOVA with Dunnett’s multiple comparison tests (e-h).
Fig. 6 |
Fig. 6 |. CAR T cells armored with Serpin B9 inhibit fratricide and enhance the anti-tumor effect.
a, Design of anti-MSLN CAR (MSLN-CAR), anti-MSLN-Serpin B9 CAR (Se9-MSLN-CAR) constructs. b, The effect of 4662 cell-derived EVs on the viability of MSLN-CAR T cells and Se9-MSLN-CAR T cells. Experiments consisted of three biologically independent samples. c, Flow cytometry showing the killing of MSLN-CAR T cells and Se9-MSLN-CAR T cells by fresh MSLN-CAR T cells. Apoptosis of MSLN-CAR T cells or Se9-MSLN-CAR T cells was detected by flow cytometry (left panel), and the percentage of apoptotic CAR T cells is calculated (right panel). Experiments consisted of three biologically independent samples. d, Schema of C57BL/6 mice bearing 4662 tumors treated with UTD, MSLN-CAR or Se9-MSLN-CAR T cells. Five mice were used in each group. e, Growth curves of tumors in mice with indicated treatments (n=5). f, Survival curves of mice with indicated treatments (n=5). g, Representative immunofluorescence images of MSLN-CAR T cells or Se9-MSLN-CAR T cells in tumor tissues. Scale bar, 20 μm. The quantification is shown to the right (n=5). h, The number of MSLN-CAR T cells or Se9-MSLN-CAR T cells in tumors for each group of mice quantified based on flow cytometry analysis (n=5). i, The percentage of live MSLN-CAR T cells or Se9-MSLN-CAR T cells in total live cells from 4662 tumors with indicated treatment quantified from flow cytometry analysis (n=5). Data represent mean ± SD (n = 3 or indicated). Five mice were used in each group. Statistical analysis is performed using is performed using two-sided unpaired t test (b, c, g-i), one-way ANOVA with Dunnett’s multiple comparison tests (e) or log-rank tests (f).
Fig. 7 |
Fig. 7 |. Combination of Se9-CAR T cells and PD-1 blockade improves the treatment of solid tumors.
a, Schema of 4662 tumors treatment in mice with MSLN-CAR T cells or Se9-MSLN-CAR T cells in combination with the anti-PD-1 antibodies. Seven mice were used in each group. b, Growth curves of 4662 tumors in mice with indicated treatments. c, 4662 tumor weights with indicated treatments. d, Survival curves of mice with 4662 tumors with indicated treatments. e, Representative immunofluorescence images of MSLN-CAR T cells or Se9-MSLN-CAR T cells in tumor tissues with different treatments. Scale bar, 20 μm. Quantification of CAR T cells in tumors is shown in f (per cm2) and g (per gram). h, Percentage of live MSLN-CAR T cells or Se9-MSLN-CAR T cells in total live cells from 4662 tumors with indicated treatments as quantified from flow cytometry analysis. i and j. The percentage of GzmB+ (i) and Ki-67+ (j) different CAR T cells quantified by flow cytometry. Data represent mean ± SD. Seven mice were used in each group. Statistical analysis is performed using Welch ANOVA with Dunnett T3 multiple comparison tests (b, c, f-j), or log-rank tests (d).

References

    1. Albelda SM CAR T cell therapy for patients with solid tumours: key lessons to learn and unlearn. Nat Rev Clin Oncol 21, 47–66 (2024). - PubMed
    1. Hou AJ, Chen LC & Chen YY Navigating CAR-T cells through the solid-tumour microenvironment. Nat Rev Drug Discov 20, 531–550 (2021). - PubMed
    1. Labanieh L & Mackall CL CAR immune cells: design principles, resistance and the next generation. Nature 614, 635–648 (2023). - PubMed
    1. Haas AR et al. Phase I Study of Lentiviral-Transduced Chimeric Antigen Receptor-Modified T Cells Recognizing Mesothelin in Advanced Solid Cancers. Mol Ther 27, 1919–1929 (2019). - PMC - PubMed
    1. Kershaw MH et al. A phase I study on adoptive immunotherapy using gene-modified T cells for ovarian cancer. Clin Cancer Res 12, 6106–6115 (2006). - PMC - PubMed

MeSH terms

LinkOut - more resources