. 2025 Apr 15;21(1):51.
doi: 10.1186/s13007-025-01369-6.

PFLO: a high-throughput pose estimation model for field maize based on YOLO architecture

Affiliations

PFLO: a high-throughput pose estimation model for field maize based on YOLO architecture

Yuchen Pan et al. Plant Methods. .

Abstract

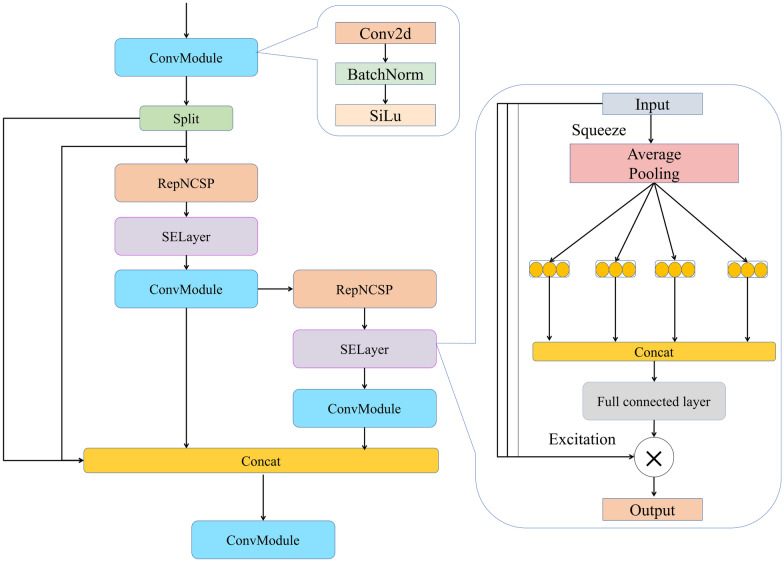
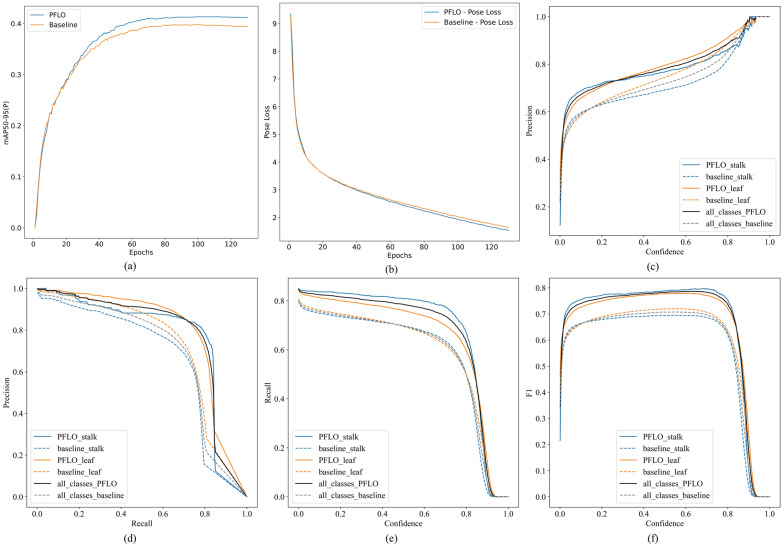
Posture is a critical phenotypic trait that reflects crop growth and serves as an essential indicator for both agricultural production and scientific research. Accurate pose estimation enables real-time tracking of crop growth processes, but in field environments, challenges such as variable backgrounds, dense planting, occlusions, and morphological changes hinder precise posture analysis. To address these challenges, we propose PFLO (Pose Estimation Model of Field Maize Based on YOLO Architecture), an end-to-end model for maize pose estimation, coupled with a novel data processing method to generate bounding boxes and pose skeleton data from a"keypoint-line"annotated phenotypic database which could mitigate the effects of uneven manual annotations and biases. PFLO also incorporates advanced architectural enhancements to optimize feature extraction and selection, enabling robust performance in complex conditions such as dense arrangements and severe occlusions. On a fivefold validation set of 1,862 images, PFLO achieved 72.2% pose estimation mean average precision (mAP50) and 91.6% object detection mean average precision (mAP50), outperforming current state-of-the-art models. The model demonstrates improved detection of occluded, edge, and small targets, accurately reconstructing skeletal poses of maize crops. PFLO provides a powerful tool for real-time phenotypic analysis, advancing automated crop monitoring in precision agriculture.

Keywords: Computer vision; Deep learning; In-field monitoring; Maize; Plant pose estimation.


Conflict of interest statement

Declarations. Ethics approval and consent to participate: Not applicable. Consent for publication: Not applicable. Competing interests: The authors declare no competing interests.

Figures

Fig. 1
Fig. 1
Illustration of data collection conditions. Scenarios including a Various imaging angles capturing complete plant structures; b representation of different growth stages (from V3 to R1); c examples of diverse lighting conditions (early morning, noon, evening) and weather; d examples of observation challenges such as self-occlusion, inter-plant occlusion, edge effects, and scale variations
Fig. 2
Fig. 2
The images in the MIPDB database and their corresponding manual annotations at different growth stages. Each row corresponds to a different growth stage, and the columns (from left to right) display the original field images, the keypoint-based skeleton visualization results, and the ground truth, respectively
Fig. 3
Fig. 3
Data process workflow. a Bounding box generation and expansion based on annotated b keypoint standardization
Fig. 4
Fig. 4
Comparison of keypoint annotation data before and after preprocessing. a Keypoint annotation data before preprocessing. b Keypoint annotation data after preprocessing. The same color indicates that keypoints belong to the same stalk or leaf, and the numbers represent the order of the keypoint data
Fig. 5
Fig. 5
The pipeline and network architecture of PFLO. Upper panel: field images undergo data preprocessing (standardizing keypoints and generating bounding boxes) before entering the PFLO model. Lower panel: the architectural design featuring RepNCSPELAN4_SE blocks (yellow), dynamic upsampling modules (Dy_Sample, light blue), Multi-SEAM modules (orange) for occlusion handling, and RepConv-based detection heads (teal) that predict both bounding boxes and keypoints simultaneously
Fig. 6
Fig. 6
Structure of the RepNCSPELAN4_SE module
Fig. 7
Fig. 7
The mechanism of the RepPose detection head. a Structure of the RepPose detection head, showing its 1×1 and 3×3 convolution branches during the training phase. b The RepPose detection head operates in different modes during training and inference, where convolutional kernels are reparameterized into a single fused kernel for inference
Fig. 8
Fig. 8
Structure of the dynamic upsample module. The module consists of an offset generation layer and a dynamic scope component that work together to produce adaptive sampling coordinates
Fig. 9
Fig. 9
Structure of the Multi-SEAM module
Fig. 10
Fig. 10
Detection metrics with different padding sizes. The x-axis represents different padding sizes, while the y-axis corresponds to the mAP50 metric
Fig. 11
Fig. 11
Learning rate optimization analysis: a Box Loss curves with different learning rates; b Pose Loss curves with different learning rates; c Box mAP50 - 95 curves with different learning rates; d Pose mAP50 - 95 curves with different learning rates; e The effect of learning rates on model performance metrics
Fig. 12
Fig. 12
Batch size optimization analysis: a Box Loss curves with different batch size; b Pose Loss curves with different batch size; c Box mAP50 - 95 curves with different batch size; d Pose mAP50 - 95 curves with different batch size; e The effect of batch size on model performance metrics
Fig. 13
Fig. 13
The metrics for pose estimation during the training process: a mAP50 - 95 (%) curve changes of Baseline and PFLO; b Pose loss curve changes of Baseline and PFLO; c Precision-confidence curve; d Precision-recall curve; e Recall-confidence curve; f F1-confidence curve
Fig. 14
Fig. 14
The metrics for object detection during the training process: a mAP50 - 95 (%) curve changes of Baseline and PFLO; b Box loss curve changes of Baseline and PFLO; c Precision-confidence curve; d Precision-recall curve; e Recall-confidence curve; f F1-confidence curve
Fig. 15
Fig. 15
PFLO detection performance and attention visualization across maize growth stages. The rows represent maize images at different growth stages, while the columns, from left to right, correspond to the ground truth, PFLO-detected maize posture, and the Grad-CAM-based heatmap visualization of regions of interest during the PFLO detection process. The heatmaps illustrate the model's attention, where warm colors (red-yellow) indicate regions of higher importance, while cooler colors (blue-green) denote less significant areas
Fig. 16
Fig. 16
Comparison of detection capabilities among different models across three typical field environments (columns A-C). The rows represent the detection results of different models, while the columns correspond to three distinct field environments

References

    1. Runge CF, Senauer B. How biofuels could starve the poor. Foreign Aff. 2007;86:41.
    1. Shiferaw B, Prasanna BM, Hellin J, Bänziger M. Crops that feed the world 6. Past successes and future challenges to the role played by maize in global food security. Food Secur. 2011;3:307–27.
    1. Fourcaud T, Zhang X, Stokes A, Lambers H, Körner C. Plant growth modelling and applications: the increasing importance of plant architecture in growth models. Ann Bot. 2008;101(8):1053–63. - PMC - PubMed
    1. Moulia B, Coutand C, Lenne C. Posture control and skeletal mechanical acclimation in terrestrial plants: implications for mechanical modeling of plant architecture. Am J Bot. 2006;93(10):1477–89. - PubMed
    1. Furbank RT, Tester M. Phenomics–technologies to relieve the phenotyping bottleneck. Trends Plant Sci. 2011;16(12):635–44. - PubMed

LinkOut - more resources