. 2025 Apr 15;23(1):442.
doi: 10.1186/s12967-025-06449-8.

Cold atmospheric plasma drives USP49/HDAC3 axis mediated ferroptosis as a novel therapeutic strategy in endometrial cancer via reinforcing lactylation dependent p53 expression

Affiliations

Cold atmospheric plasma drives USP49/HDAC3 axis mediated ferroptosis as a novel therapeutic strategy in endometrial cancer via reinforcing lactylation dependent p53 expression

Jinlin Liu et al. J Transl Med. .

Abstract

Background: Endometrial cancer ranks among the most common gynecological cancers, with increasing rates of incidence and death. Cold atmospheric plasma (CAP) has become a promising novel therapeutic approach for cancer treatment. Nevertheless, the specific impact of CAP on endometrial cancer remains inadequately characterized.

Objectives: This study aimed to investigate the effect of CAP on the progression of endometrial cancer and reveal its specific regulatory mechanisms.

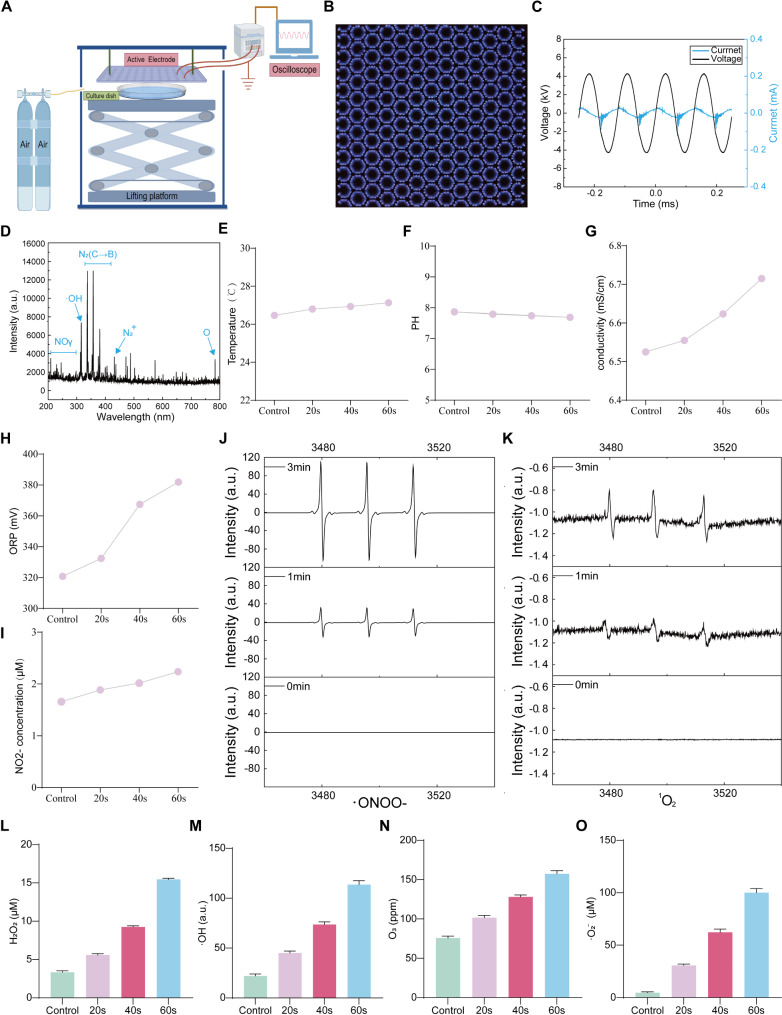
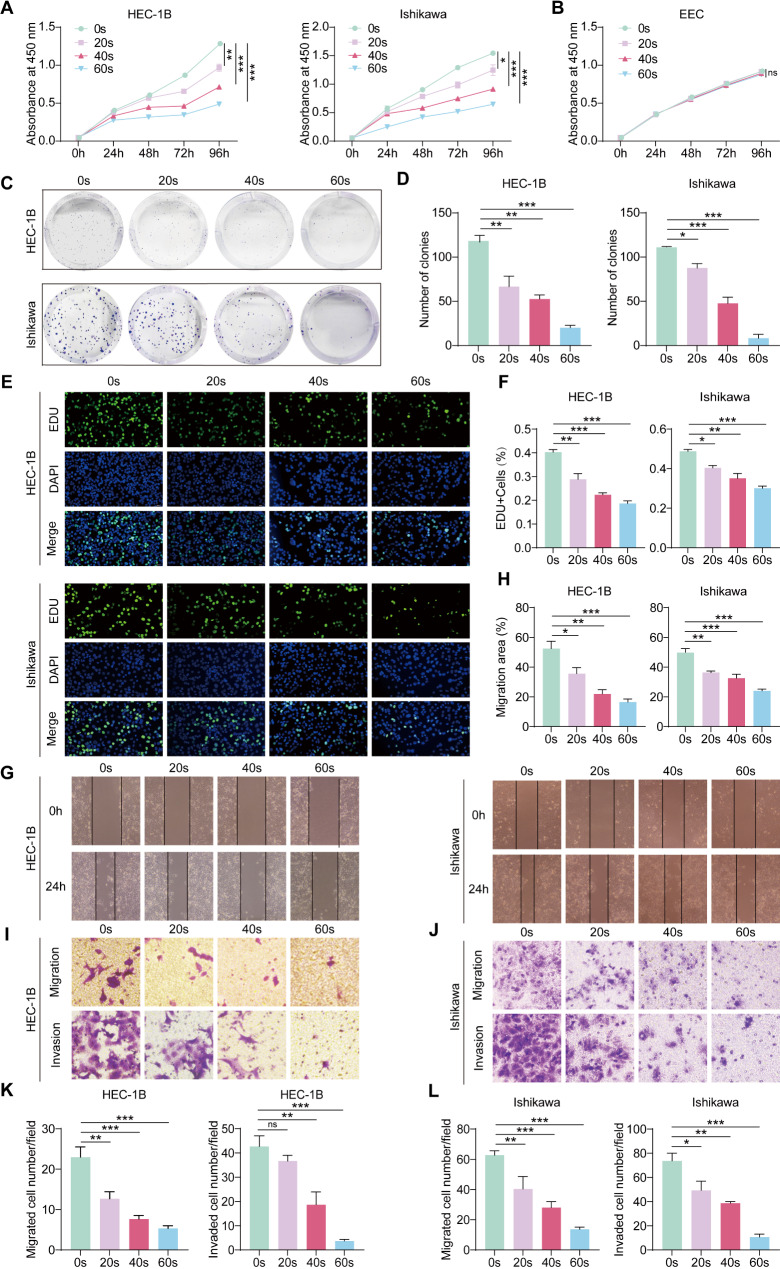
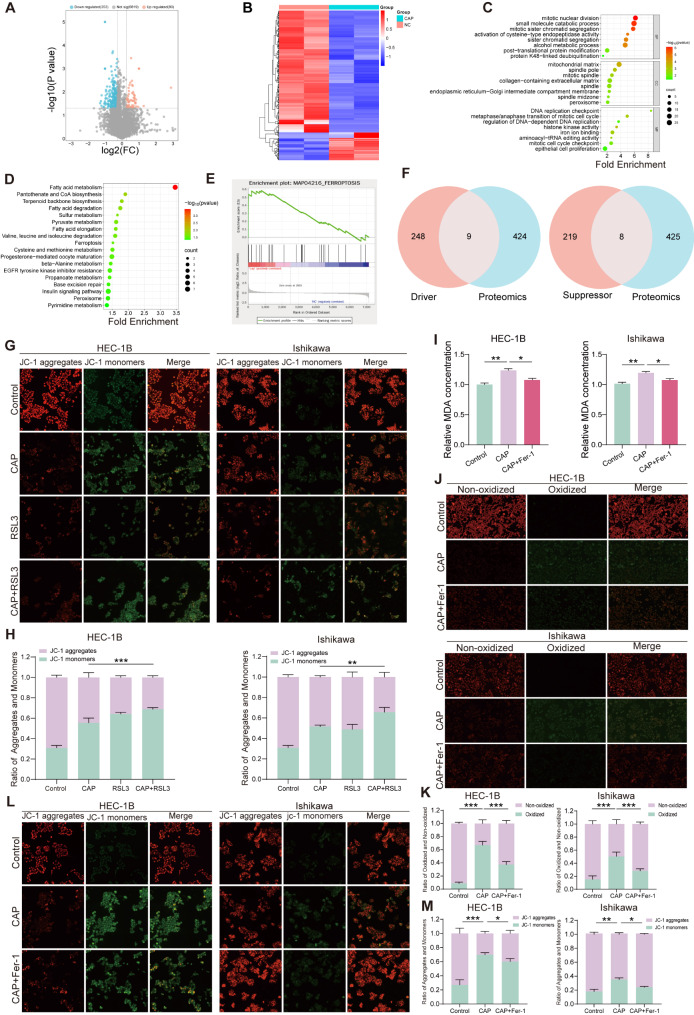
Methods: Colony formation, EdU, wound-healing, and transwell assay were used to detect the effect of CAP on endometrial cancer progression. Proteomics is employed to identify potential targets and signaling pathways through which CAP impacts endometrial cancer cells. MDA, lipid ROS, and JC-1 MMP assays were used to detect ferroptosis. Immunoprecipitation-mass spectrometry, co-immunoprecipitation, immunofluorescence co-localization, and molecular docking were used to analyze USP49 and HDAC3 interactions. The tumor xenografts model determined that CAP inhibits endometrial cancer growth in vivo.

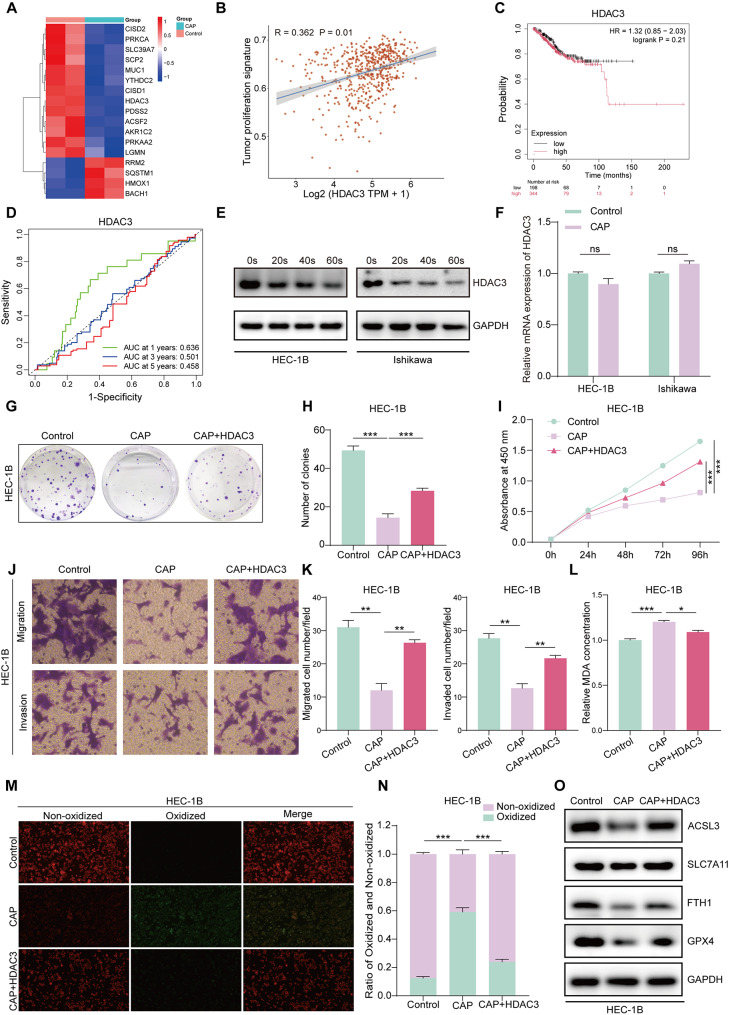
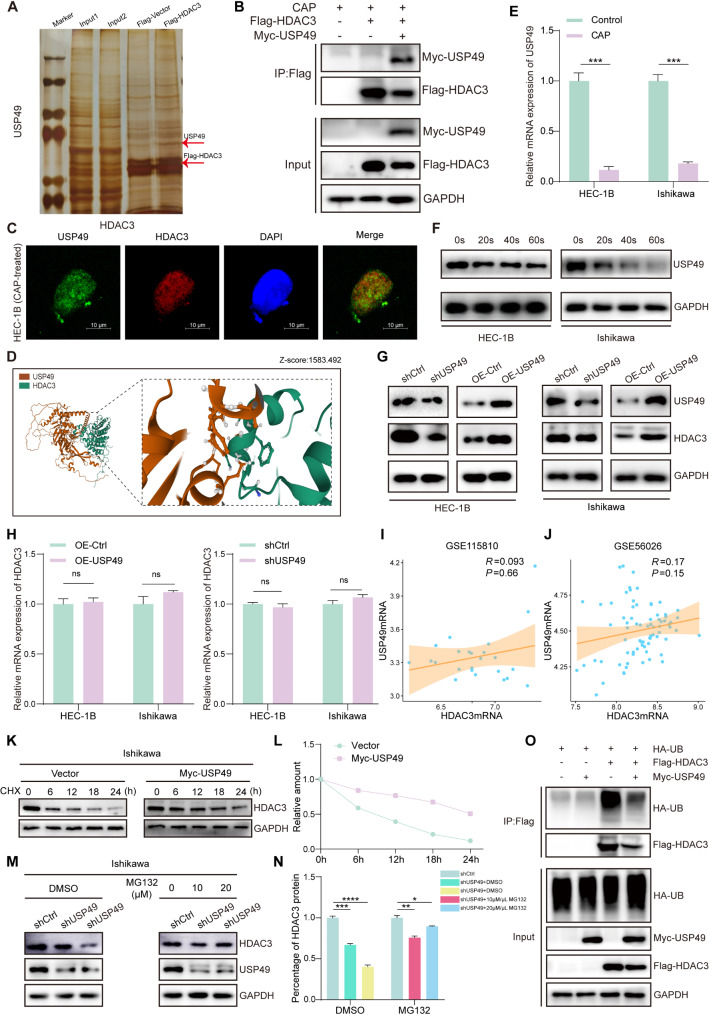
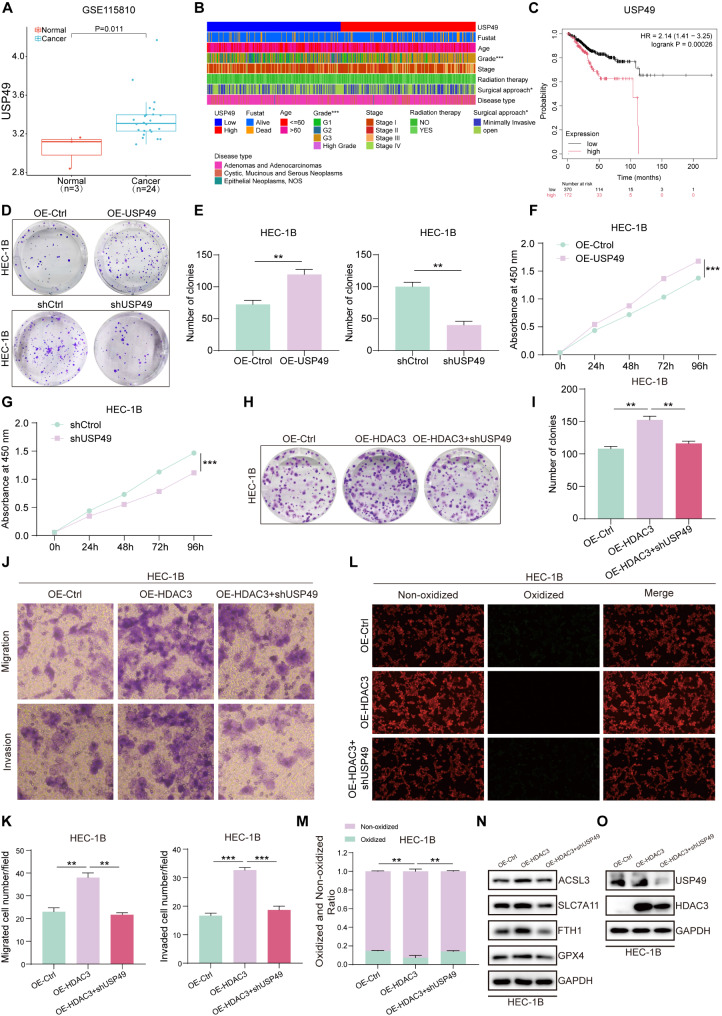
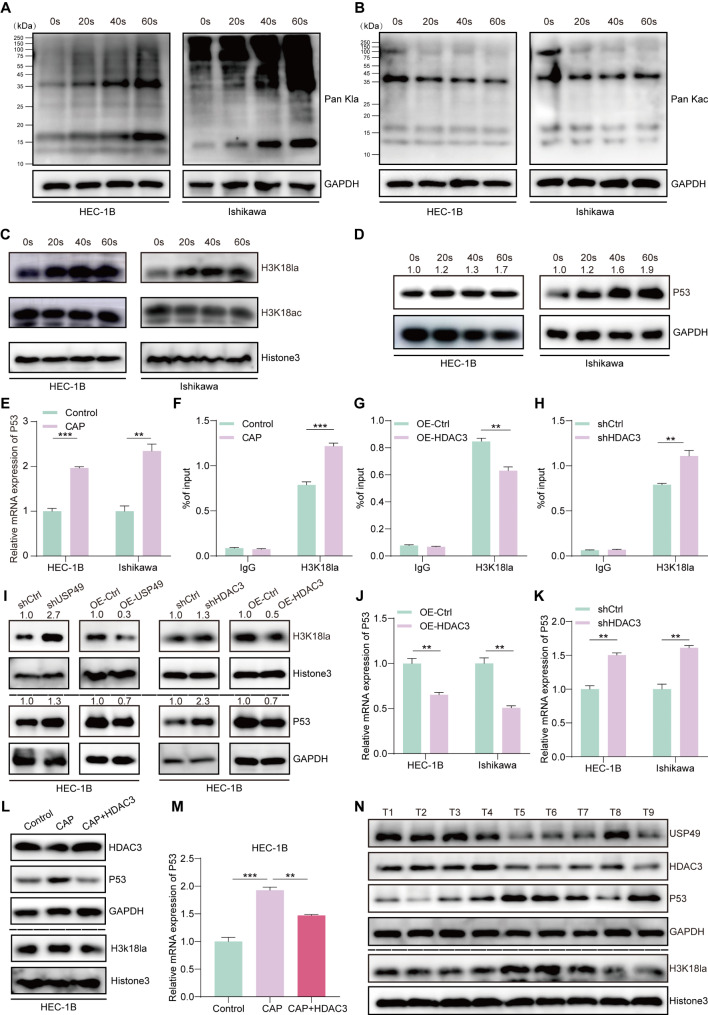
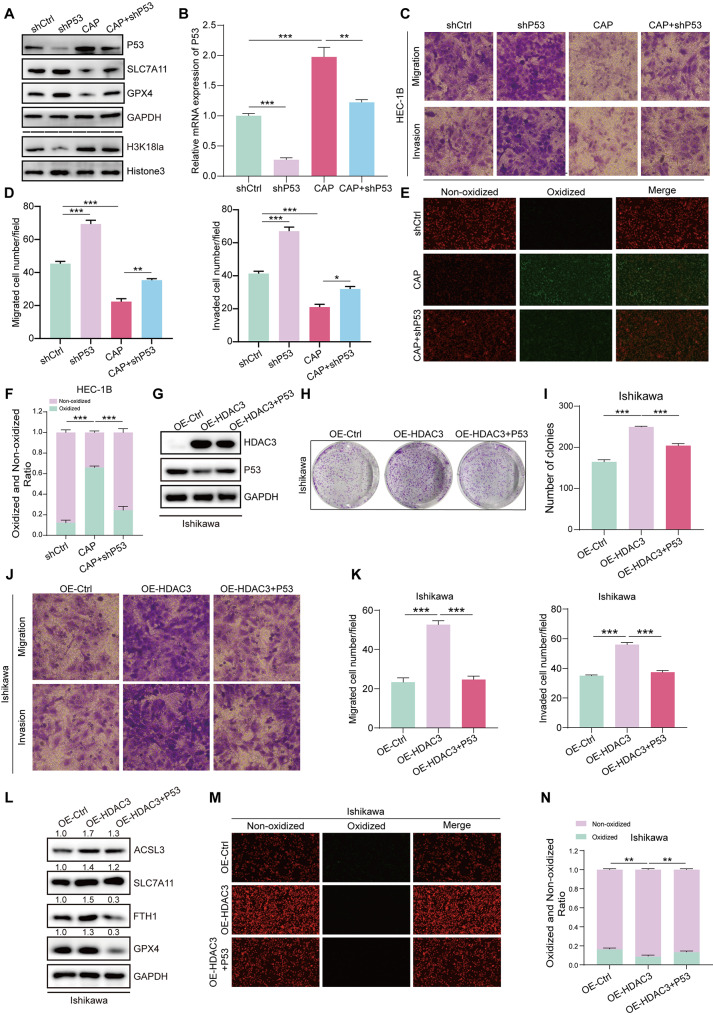
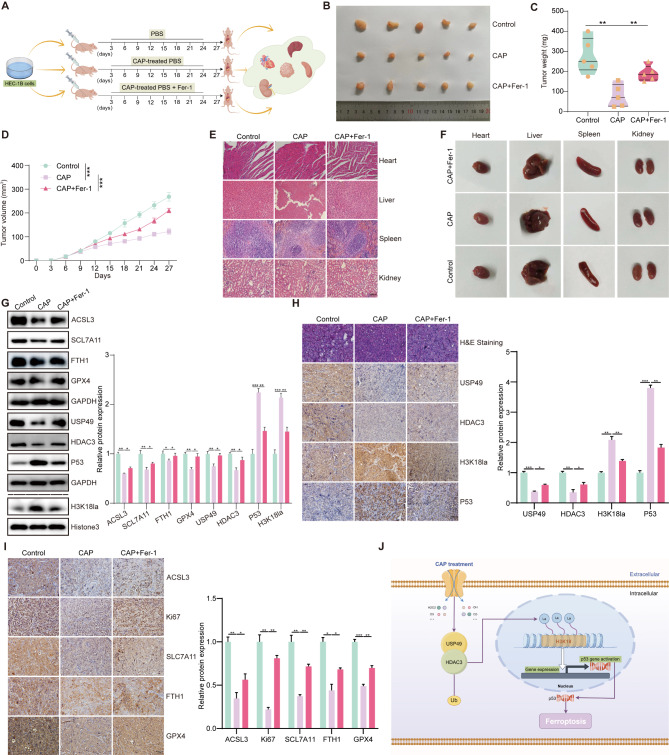
Results: This study observed a significant inhibitory effect of CAP on the proliferation and migration of endometrial cancer cells and reported for the first time that CAP induces ferroptosis in endometrial cancer cells. Mechanistically, CAP activated the transcription of p53 by modulating HDAC3 mediated the histone H3K18 lactylation, resulting in upregulation of p53 driving cell ferroptosis. The interaction between USP49 and HDAC3 was validated through mass spectrometry and co-immunoprecipitation experiments. The regulation of HDAC3 by CAP is contingent upon USP49, wherein the down-regulation of USP49 augments the ubiquitination of HDAC3, consequently diminishing its protein stability. Furthermore, animal models with transplanted tumors corroborated the inhibitory impact of CAP on endometrial cancer in vivo.

Conclusions: Our findings illustrate the suppressive effect of CAP treatment on endometrial cancer and uncover a novel regulatory mechanism mediated by CAP. Specifically, CAP modulates the ferroptosis pathway through the HDAC3/H3K18la/p53 axis, presenting a novel therapeutic approach for endometrial cancer treatment.

Keywords: CAP; Endometrial cancer; Ferroptosis; HDAC3; p53.


Conflict of interest statement

Declarations. Ethics approval and consent to participate: All aspects of this study were approved by the Ethics Committee of the Third Affiliated Hospital of Zhengzhou University (Approval Number: 2020-133-01 ). Consent for publication: All authors acknowledge and consent to the paper’s content and are included as co-authors. Competing interests: The authors declare no competing interests.

Figures

Fig. 1
Fig. 1
The physical and chemical characteristics of the active ingredients. (A) Diagrammatic representation of the CAP experimental setup. (B) Schematic representation of the electrode surface during the discharge process. (C) The applied voltage waveform (depicted in black) and current waveform (depicted in blue) are shown. (D) CAP’s 200–800 nm end-on optical emission spectrum (E-O): The variations in temperature (E), PH (F), conductivity of electricity (G), ORP (H), NO2- (I), •ONOO- (J) and 1O2 (K), H2O2 (L), •OH (M), O3(N), •O2- (O) for the prescribed duration of CAP treatment
Fig. 2
Fig. 2
CAP impedes the proliferation, migration, and invasion of endometrial cancer cells in vitro. (A, B) CCK-8 assay detects cell viability in HEC-1B, Ishikawa, and EEC cells. (C-F) colony formation (C, D) and EdU assays (E, F) were conducted to assess the proliferative effects of CAP therapy during the specified duration (0s, 20s, 40s, and 60s) on HEC-1B and Ishikawa cells. (G-L) Wound-healing (G, H) and transwell (I-L) assay showed how CAP affects HEC-1B and Ishikawa cell invasion and migration. Data are shown as means ± standard deviation (SD). *: p < 0.05; **: p < 0.01; ***: p < 0.001
Fig. 3
Fig. 3
CAP facilitates ferroptosis signal pathway in endometrial cancer cells. (A) Significantly altered protein expression in HEC-1B cells is depicted by a volcano plot (blue is down-regulated, orange is down-regulated). (B) Heatmap illustrating distinct proteins following CAP treatment. (C, D) GO and KEGG analyses were conducted on the differential proteins obtained by proteomics. (E) GSEA revealed CAP treatment group enrichment of the ferroptosis signalling pathway. (F) A Venn diagram depicting the probable targets of ferroptosis related to CAP therapy alongside FerrDb, an extensive ferroptosis database. (G, H) Fluorescence images of JC-1 stained HEC-1B and Ishikawa cells following different treatments: control, CAP, RSL3, and CAP + RSL3. Red JC-1 aggregates show normal mitochondrial membrane potentials, while green JC-1 monomers indicate depolarized membrane potentials. The fluorescence images were used to determine JC-1’s red/green fluorescence ratios. (n = 3). (I) The MDA test was used to measure the lipid peroxidation levels of HEC-1B and Ishikawa cells treated with CAP. (J, K) lipid ROS was assessed by BODIPY-C11 staining and statistical analysis. Oxidized (red fluorescence, Ex = 540–580 nm, Em = 600–660 nm) and non-oxidized (green fluorescence, Ex = 450–490 nm, Em = 500–550 nm). The ratio of red (oxidized) to green (non-oxidized) fluorescence determines the degree of lipid peroxidation. (L, M) Fluorescence images of JC-1 stained HEC-1B and Ishikawa cells following different treatments: control, CAP, and CAP + Fer-1. Data are shown as means ± standard deviation (SD). *: p < 0.05; **: p < 0.01; ***: p < 0.001
Fig. 4
Fig. 4
CAP enhances ferroptosis in endometrial cancer cells by suppressing HDAC3 expression. (A) Heatmap displaying the possible ferroptosis targets linked to CAP therapy in conjunction with FerrDb. (B) Relationship between HDAC3 expression and tumor proliferation pathway in endometrial cancer obtained from TCGA. (C) Kaplan-Meier survival analysis showed a correlation with HDAC3 expression levels and overall survival in patients with endometrial cancer. (D) ROC curves of HDAC3 at different times in endometrial cancer. (E) Western blot analysis of HDAC3 protein expression levels following CAP therapy. (F) Following CAP treatment, RT-qPCR assays were used to measure the HDAC3 mRNA levels. (G, H) Colony formation assays were employed to evaluate cellular proliferation capacity. Representative images are shown on the left, and statistical analysis is presented on the right. (I) Cellular activity was detected by CCK8 assay. (J, K) The transwell migration assay was used to evaluate the migration and invasion ability of HEC-1B cells. Representative images are shown on the left, and statistical analysis is shown on the right. (L) The MDA assay was used to determine the levels of lipid peroxidation in each group. (M, N) BODIPY-C11 staining (left) and statistical analysis (right) were used to measure lipid ROS. Oxidized (red fluorescence, Ex = 540-580 nm, Em = 600-660 nm) and non-oxidized (green fluorescence, Ex = 450-490 nm, Em = 500-550 nm). The ratio of red (oxidized) to green (non-oxidized) fluorescence determines the degree of lipid peroxidation. (O) Western blots were used to determine the protein expression levels of ACSL3, SLC7A11, FTH1, and GPX4 in various groups. Data are shown as means ± standard deviation (SD).:* p < 0.05;:** p < 0.01;:*** p < 0.001
Fig. 5
Fig. 5
The deubiquitinase USP49 interacts with HDAC3 and enhances its stability. (A) Mass spectrometry revealed that HDAC3 was linked to USP49. (B) CAP-treated HEC-1B cells were used for Co-IP experiments. (C) Co-localization of HDAC3 and USP49 in CAP-treated HEC-1B nuclei was observed by laser confocal microscopy (scale bar: 10 μm). (D) Molecular docking analysis of binding between HDAC3 and USP49. (E) USP49 mRNA was measured by RT-qPCR after CAP treatment. (F) Protein expression levels of USP49 detected by Western blot after CAP treatment. (G, H) HDAC3 mRNA and protein levels were determined in HEC-1B and Ishikawa cell lines transfected with USP49-shRNA or overexpressing USP49. (I, J) The connection between USP49 mRNA and HDAC3 mRNA in RNA-seq study using the GEO database GSE115810 (I) and GSE56026 (J). (K, L) Degradation of the HDAC3 protein was measured after 100 µg/ml CHX treatment in Ishikawa cell. (M, N) Western blot analysis was conducted to assess HDAC3 expression following 12-hour treatment with 10 or 20 µM MG132 in Ishikawa stable cell lines, with data presented as a fold-change compared to the control. (O) HDAC3 ubiquitination was examined by immunoprecipitation using an anti-Flag antibody, then detected with anti-HA and anti-Flag antibodies through immunoblotting. This procedure was conducted in HEC-1B cells that had been transfected with the specified constructs. Data are shown as means ± standard deviation (SD). *: p < 0.05; **: p < 0.01; ***: p < 0.001
Fig. 6
Fig. 6
USP49 facilitates the progression of endometrial cancer cells by modulating the expression of HDAC3. (A) Analysis of USP49 expression in normal and cancer tissues using data from the GEO Database (GSE115810). (B) Relationship of USP49 expression with clinical and prognostic information in endometrial cancer from the TCGA dataset. (C) Kaplan-Meier survival analysis demonstrates the overall survival rates of endometrial cancer patients concerning USP49 expression levels. (D-G) Clone formation (D, E) and CCK8 (F, G) assays demonstrate the proliferation rate of HEC-1B cells with USP49-shRNA transfection and USP49 plasmid overexpression. (H, I) A colony formation assay was conducted to assess the proliferation impact on HEC-1B cells. (J, K) The migration and invasion abilities of OE-Ctrl/OE-HDAC3/OE-HDAC3 + shUSP49 were assessed using Transwell migration and invasion assays. (L, M) lipid ROS of different groups was assessed by BODIPY-C11 staining. Oxidized (red fluorescence, Ex = 540–580 nm, Em = 600–660 nm) and non-oxidized (green fluorescence, Ex = 450–490 nm, Em = 500–550 nm). The ratio of red (oxidized) to green (non-oxidized) fluorescence determines the degree of lipid peroxidation. (N, O) Western blot analysis was used to measure the expression levels of proteins related to ferroptosis, as well as HDAC3 and USP49, across various groups. Data are shown as means ± standard deviation (SD). *: p < 0.05; **: p < 0.01; ***: p < 0.001
Fig. 7
Fig. 7
Induction of p53 expression by CAP involves lactylation of histone H3K18 by HDAC3. (A, B) Western blot assay was performed using pan-lactylation and pan-acetylation antibodies (A) and acetylation (B) levels in HEC-1B and Ishikawa cells after CAP treatment (0s, 20s, 40s, and 60s). (C) Western blot was used to detect the levels of H3K18 lactylation and acetylation at the indicated times. (D, E) Western blot (D) and RT-qPCR (E) were used to measure p53 expression levels at the indicated times. (F-H) ChIP-qPCR was conducted to detect the enrichment of H3K18la on the p53 promoter region. (I-K) The expression of H3K18la and p53 were assessed via western blot and RT-qPCR analysis following transfection with the specified plasmids. (L) H3K18la and p53 protein levels were assessed using Western blot assays after CAP treatment or HDAC3 overexpression. (M) p53 mRNA levels were measured by RT-qPCR following CAP treatment or HDAC3 overexpression. (N) Western blot analysis was performed to examine the expression of USP49, HDAC3, H3K18la, and p53 in tumor tissues from endometrial cancer. Data are shown as means ± standard deviation (SD). *: p < 0.05; **;: p < 0.01; ***: p < 0.001
Fig. 8
Fig. 8
CAP suppresses the progression of endometrial cancer cells and inhibits ferroptosis through up-regulating p53 expression. (A) Effect of knockdown of p53 with CAP on SLC7A11, GPX4 and H3K18la protein expression. (B) RT-qPCR detection of knockdown efficiency of p53 at mRNA level. (C, D) The transwell test demonstrated the effect of p53 on HEC-1B migration and invasion. (E, F) Lipid ROS in HEC-1B cells was evaluated using BODIPY-C11 staining. Oxidized (red fluorescence, Ex = 540-580 nm, Em = 600-660 nm) and non-oxidized (green fluorescence, Ex = 450-490 nm, Em = 500-550 nm). The ratio of red (oxidized) to green (non-oxidized) fluorescence determines the degree of lipid peroxidation. (G) Western blotting assessed the transfection efficiencies of HDAC3 and p53. (H, I) Clone formation assay demonstrating the proliferation of HEC-1B cells transfected with HDAC3 or co-transfected with HDAC3 and p53. (J, K) The migratory and invasive potential of HEC-1B cells transfected with HDAC3 or co-transfected with HDAC3 and p53 plasmids, as shown by the Transwell assay. (L) Western blotting assessed the expression levels of ACSL3, SLC7A11, FTH1, and GPX4 proteins in different groups of transfected HEC-1B cells. (M, N) Lipid ROS in HEC-1B cells transfected with HDAC3 or co-transfected with HDAC3, and p53 were measured using BODIPY-C11 staining. Oxidized (red fluorescence, Ex = 540-580 nm, Em = 600-660 nm) and non-oxidized (green fluorescence, Ex = 450-490 nm, Em = 500-550 nm). The ratio of red (oxidized) to green (non-oxidized) fluorescence determines the degree of lipid peroxidation. Data are shown as means ± standard deviation (SD).*: p < 0.05; **: p < 0.01; ***: p < 0.001
Fig. 9
Fig. 9
CAP suppresses the advancement of endometrial cancer by triggering ferroptosis in vivo.(A) Chart depicting the process of nude mice xenograft assay. (B, C) At the conclusion of the study, the mice were euthanized and dissected. Tumor growth and weight were then assessed. (D) The tumor volumes in the nude mice were assessed at 3-day intervals. (E) Images of H&E stained hearts, livers, spleens, and kidneys in each group (20x). (F) Representative heart, liver, spleen, and kidney images. (G) Western blot was used to detect ACSL3, SLC7A11, FTH1, GPX4, USP49, HDAC3, p53, and H3K18la protein expression levels. (H, I) Representative H&E staining images of tumor tissue, alongside IHC staining images for USP49, HDAC3, H3K18la, p53, Ki-67, ACSL3, SLC7A11, FTH1, and GPX4 at a magnification of 20×. The scale bar represents 100 μm. Data are shown as means ± standard deviation (SD). *: p < 0.05; **: p < 0.01; ***: p < 0.001

Similar articles

References

    1. Hong R, Liu W, DeLair D, Razavian N, Fenyö D. Predicting endometrial cancer subtypes and molecular features from histopathology images using multi-resolution deep learning models. Cell Rep Med. 2021;2:100400. - PMC - PubMed
    1. Ren X, Liang J, Zhang Y, Jiang N, Xu Y, Qiu M, Wang Y, Zhao B, Chen X. Single-cell transcriptomic analysis highlights origin and pathological process of human endometrioid endometrial carcinoma. Nat Commun. 2022;13:6300. - PMC - PubMed
    1. Wang Y, Yin L, Sun X. CircRNA Hsa_circ_0002577 accelerates endometrial cancer progression through activating IGF1R/PI3K/Akt pathway. J Exp Clin Cancer Res. 2020;39:1–16. - PMC - PubMed
    1. Abu-Rustum N, Yashar C, Arend R, Barber E, Bradley K, Brooks R, Campos SM, Chino J, Chon HS, Chu C, et al. Uterine neoplasms, version 1.2023, NCCN clinical practice guidelines in oncology. J Natl Compr Canc Netw. 2023;21:181–209. - PubMed
    1. Makker V, MacKay H, Ray-Coquard I, Levine DA, Westin SN, Aoki D, Oaknin A. Endometrial cancer. Nat Rev Dis Primers. 2021;77:88. - PMC - PubMed

MeSH terms

LinkOut - more resources