. 2025 Apr 1;42(4):msaf091.
doi: 10.1093/molbev/msaf091.

Sex-Biased Admixture Followed by Isolation and Adaptive Evolution Shaped the Genomic and Blood Pressure Diversity of the LopNur People

Affiliations

Sex-Biased Admixture Followed by Isolation and Adaptive Evolution Shaped the Genomic and Blood Pressure Diversity of the LopNur People

Jia Wen et al. Mol Biol Evol. .

Abstract

The LopNur people are an ethnic group living on the edge of the Taklamakan Desert, and they are believed to demonstrate a unique genetic makeup due to their isolation and limited contact with neighboring populations. However, a lack of genetic studies on the LopNur people has resulted in limited knowledge about their ancestral origins and demographic history. Here, we conducted the first whole-genome sequencing study of 164 LopNur individuals (LOP) to gain insight into their genetic history and adaptive evolution in an isolated desert area. Our analysis revealed that the present-day LOP have experienced a complex history of admixture followed by long-term isolation, with their ancestry derived from East Asia (∼41.46%), West Eurasia (∼26.43%), Siberia (∼24.27%), and South Asia (∼7.82%). Notably, a remarkable sex-biased admixture occurred between Western males and Eastern females. In addition to complex admixture followed by long-term geographic isolation and further recent migrations, adaptive evolution jointly formed the gene pool and phenotypic diversity of the present-day LOP. Intriguingly, our analysis suggests that the USP35-GAB2 region may be correlated with blood pressure in LOP, based on a joint analysis of genomics and blood pressure data. Moreover, we identified two variants, rs7387065, and rs2229437, located on CSMD1 and PRCP, respectively. These variants exhibited frequency differences between Asian and European populations and were reported to be associated with antihypertensive drug absorption. Our results provide new insight into the complex history of the LOP, an admixed and isolated ethnic group residing at the crossroads of East and West, a case with ancient admixture, long-term isolation, adaptive evolution, and sex-biased gene flow.

Keywords: LopNur people; genetic admixture; hypertension; isolation; local adaptation; precision medicine.


Conflict of interest statement

Conflict of Interest: The authors declare that they have no competing interests.

Figures

Fig. 1.
Fig. 1.
Population structure and genetic affinity of LOP. a) PCA of LOP and Eurasian reference populations. Different populations of individuals are indicated with different colors and shapes, as shown in the legend. The numbers in brackets denote the variance explained by each PC. b) A fan-like chart showing genetic affinity measured by FST between LOP and other Central Asian or Siberian populations. c) PCA of LOP and XJU. d) Population tree of LOP and reference populations (the African [Yoruba], European [Sardinian], South Asian [Mala], East Asian [Han], and Siberian [Eskimo] populations and Uyghurs [XJU]). Numbers on the tree indicate the bootstrap probability of each node.
Fig. 2.
Fig. 2.
Ancestry makeup and genetic history of LOP. a) ADMIXTURE results of LOP with West Eurasia, South Asia, East Asia, and Central Asia/Siberia populations at K = 4. All populations of the four major ancestries (including representative populations) were included to show a full picture of ancestry composition of Eurasian populations with AncestryPainter 2.0 (Chen et al. 2024). The proportion of each ancestry in LOP is highlighted with a pie chart. The height of the bar is proportional to the admixture proportion. b) ADMIXTURE results of LOP with other Eurasian populations at K = 8. c) Inferred admixture models of LOP showing the admixture proportion and admixture time. EEA, Eastern Eurasian ancestry; WEA, Western Eurasian ancestry; G, generation. d) Recent population demography of LOP according to IBD sharing using IBDNe.
Fig. 3.
Fig. 3.
Sex-biased admixture in LOP. a) The estimated genetic makeup of LOP individuals according to ADMIXTURE analyses using SNV markers of autosomes and the X chromosome. The samples were ordered from highest to lowest by the eastern ancestry proportion according to the autosome results. b) Estimated ancestral makeup of LOP according to SNV markers of autosomes, the X chromosome, the Y chromosome, and mtDNA. The “***” indicates P < 0.001. c) Distributions of the X/A ratios of the mean ancestry proportion. The different colors represent different ancestral components, and deviation from one indicates sex-biased admixture.
Fig. 4.
Fig. 4.
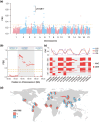
Local adaptation identified in LOP. a) Manhattan plot showing the PBS values in genome-wide scans for LOP, using CHB and CEU as reference populations. The 99.995th and 99.999th percentiles of the PBS distribution are shown as dashed horizontal lines. The gene with the highest PBS values is labeled. b) The genomic region located on chromosome 4 under positive selection was identified by the PBS. c) Haplotype plot of the selective region on chromosome 4 in EUR, EAS, XJU, and LOP, where each horizontal line indicates one haplotype and the x-axis indicates the ID of representative SNVs. The plot on the top illustrates the DAF of each SNV. ANC, ancestral allele; DER, derived allele. d) The allele frequency distribution of worldwide populations for rs6817882 within UGT2B17.
Fig. 5.
Fig. 5.
Adaptive genetic variants associated with essential hypertension in LOP. a) Genetic differences identified by FST between the EH and NT groups. The 99.995th percentiles of the FST distribution are shown as dashed horizontal lines. Gene symbols with significant peaks are labeled. b) Local Manhattan plot showing the FST values spanning the top signals. c) The SNVs located on the gene with the strongest selection signal and with significant frequency differences in the EH and NT groups. d) Local Manhattan plot showing the XP-EHH values spanning the most significant signals. e) The allele frequency distribution of rs7387065 in Eurasian populations.

References

    1. Abdurehim E. The LopNor dialect of Uyghur. Helsinki: University of Helsinki Printing House (Unigrafia); 2014.
    1. Alexander DH, Novembre J, Lange K. Fast model-based estimation of ancestry in unrelated individuals. Genome Res. 2009:19(9):1655–1664. 10.1101/gr.094052.109. - DOI - PMC - PubMed
    1. Altshuler DM, Durbin RM, Abecasis GR, Bentley DR, Chakravarti A, Clark AG, Donnelly P, Eichler EE, Flicek P, Gabriel SB, et al. A global reference for human genetic variation. Nature. 2015:526(7571):68–74. 10.1038/nature15393. - DOI - PMC - PubMed
    1. Ametjan A, Gan GQ. The research review of LopNur people since the reform and opening up. J Kashgar Teachers Coll. 2014:35(1). 10.13933/j.cnki.j.kashgar.teach.coll.2014.01.024. - DOI
    1. Aragam KG, Jiang T, Goel A, Kanoni S, Wolford BN, Atri DS, Weeks EM, Wang M, Hindy G, Zhou W, et al. Discovery and systematic characterization of risk variants and genes for coronary artery disease in over a million participants. Nat Genet. 2022:54(12):1803–1815. 10.1038/s41588-022-01233-6. - DOI - PMC - PubMed

Supplementary concepts

LinkOut - more resources