. 2025 Apr;16(2):e13810.
doi: 10.1002/jcsm.13810.

Transcriptional Intermediary Factor 1γ-Induced Irisin in Skeletal Muscle Attenuates Renal Fibrosis in Diabetic Nephropathy

Affiliations

Transcriptional Intermediary Factor 1γ-Induced Irisin in Skeletal Muscle Attenuates Renal Fibrosis in Diabetic Nephropathy

Jin Hyun Kim et al. J Cachexia Sarcopenia Muscle. 2025 Apr.

Abstract

Background: Transcriptional intermediary factor 1γ (TIF1γ) is a negative regulator of TGF-β1 signalling and has been associated with patient survival in renal cell carcinoma. However, its role in diabetes mellitus (DM), particularly in diabetic nephropathy (DN), remains unclear. DN is the leading cause of chronic kidney disease (CKD). We investigated the potential role of TIF1γ in mitigating multiple DM-related complications.

Methods: Mice were divided into four groups: db/m+, db/db and db/db mice treated with cytomegalovirus- or TGF-TIF1γ plasmids (40 μg/mouse; intraperitoneally weekly for 16 weeks). Renal injury, fibrosis, function and gene expression related to fibrosis and epithelial-mesenchymal transition (EMT) in the kidneys were assessed. Muscle atrophy, regeneration markers, myokine levels and exercise capacity were evaluated. C2C12 cells were exposed to palmitate with or without TIF1γ transfection, and irisin expression and secretion were measured. Muscle-kidney crosstalk was analysed using conditioned media (CM) from TIF1γ-transfected C2C12 cells in palmitate-treated human kidney (HK)-2 cells. Additionally, HK-2 cells were incubated in CM from fibronectin type III domain-containing protein (FNDC)5-knockdown C2C12 cells to confirm irisin-mediated kidney crosstalk by TIF1γ.

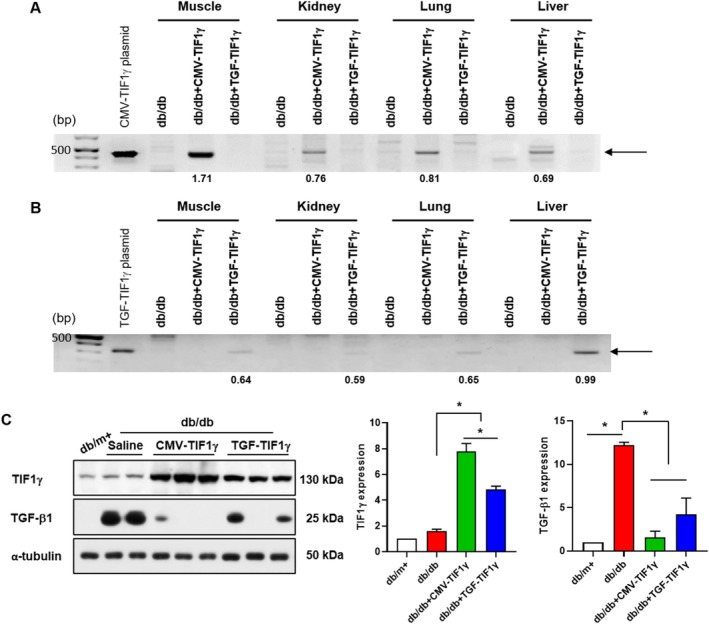
Results: TIF1γ treatment in db/db mice resulted in a significant attenuation of renal tubulointerstitial fibrosis (1.5-fold decrease), glomerular injury (1.8-fold improvement), tubular injury (1.6-fold improvement), renal dysfunction (1.7-fold improvement) and a reduction in EMT-related factors (1.8-fold decrease) (p < 0.05). The levels of administered TIF1γ plasmids were higher in skeletal muscle than in renal tissues. TIF1γ expression was significantly elevated in the skeletal muscle of db/db mice treated with TIF1γ plasmids (6.5-fold) (p < 0.05). Mice receiving both plasmids exhibited a 1.8-fold reduction in pathological muscle morphology and atrophy-related gene expression, a 3.0-fold increase in regeneration-related gene expression and a 1.6-fold improvement in muscle function (p < 0.05). Irisin expression increased by 2.1-fold in skeletal muscle and serum (p < 0.05). In TIF1γ-transfected C2C12 cells, irisin secretion was elevated by 1.5-fold (p < 0.05). CM from TIF1γ-transfected C2C12 cells attenuated EMT in palmitate-treated HK-2 cells, compared with medium from nontransfected C2C12 cells (1.9-fold improvement [p < 0.05]). Conversely, FNDC5 knockdown in C2C12 cells accelerated EMT in palmitate-treated HK-2 cells, as evidenced by decreased bone morphogenetic protein-7 (1.6-fold) and increased EMT-related factors (2.1-fold) (p < 0.05), compared with palmitate alone and small interfering RNA control.

Conclusions: Our findings emphasize the potential of TIF1γ as a multitargeted therapeutic agent for DN, mitigating both renal and muscular complications through direct fibrosis inhibition and indirect myokine-mediated inter-organ crosstalk.

Keywords: chronic kidney disease; diabetic nephropathy; fibrosis; irisin; muscle‐kidney crosstalk; transcriptional intermediary factor 1γ.


Conflict of interest statement

The authors declare no conflicts of interest.

Figures

FIGURE 1
FIGURE 1
Renal morphology in db/db mice treated with or without CMV‐TIF1γ and TGF‐TIF1γ (40 μg/mouse, intraperitoneal). (A) Representative kidney sections stained with PAS and MT, showing tubular and glomerular pathological changes. Tubulointerstitial fibrosis is assessed using α‐SMA immunostaining (α‐SMA in A). Scale bar: 100 μm. (B) Glomerular alterations are evaluated using antinephrin and antipodocin immunostaining (Nephrin and Podocin in B). Scale bar: 50 μm. (C) TIF1γ administration ameliorates kidney function deterioration in db/db mice. Kidney weight relative to body weight, urinary albumin levels and the ACR are measured. Statistical significance was determined using a one‐way analysis of variance followed by Tukey's multiple comparison test. Data are presented as mean ± SEM. *p < 0.05. TIF1γ, transcriptional intermediary factor 1γ; TGF, transforming growth factor; CMV, cytomegalovirus; PAS, periodic acid‐Schiff; MT, Masson's trichrome; α‐SMA, alpha‐smooth muscle actin; ACR, albumin‐to‐creatinine ratio; SEM, standard error of the mean.
FIGURE 2
FIGURE 2
Effect of TIF1γ treatment on EMT markers in db/db mice. (A) Effect of TIF1γ plasmid (40 μg) treatment on mRNA expression levels of EMT markers (TGF‐β1, α‐Sma) and the EMT‐specific transcriptional factor (Twist) were assessed in the kidney using qPCR. (B) Representative immunoblot images and quantitative analysis showing the expression levels of TIF1γ and EMT‐related markers (TGF‐β1, α‐SMA, αβ‐crystalline and pSmad2/3). Statistical significance was determined using a one‐way analysis of variance followed by Tukey's multiple comparison test. Data are presented as mean ± SEM. *p < 0.05. TIF1γ, transcriptional intermediary factor 1γ; EMT, epithelial–mesenchymal transition; TGF‐β1, transforming growth factor beta 1; α‐SMA, alpha‐smooth muscle actin; pSmad2/3, phosphorylated Smad2/3; qPCR, quantitative polymerase chain reaction; mRNA, messenger RNA; SEM, standard error of the mean.
FIGURE 3
FIGURE 3
TIF1γ plasmid tracing in various tissues from db/db mice using PCR. (A) Representative PCR data using primers targeting the CMV promoter. (B) Representative PCR data using primers targeting the TGF promoter. Effect of TIF1γ treatment (40 μg) on the expression of TIF1γ and TGF‐β1 in the quadriceps muscle of db/db mice. (C) Representative immunoblot images and quantitative analysis of TIF1γ and TGF‐β1 expression in quadriceps. Statistical significance was determined using a one‐way analysis of variance followed by Tukey's multiple comparison test. Data are presented as mean ± SEM. *p < 0.05. TIF1γ, transcriptional intermediary factor 1γ; CMV, cytomegalovirus; TGF, transforming growth factor; PCR, polymerase chain reaction; CMV‐ and TGF‐TIF1γ plasmid, 1‐fg plasmid; SEM, standard error of the mean.
FIGURE 4
FIGURE 4
Morphological changes in the quadriceps muscle following TIF1γ treatment. (A & B) Representative H&E and MT staining of quadricep muscles of db/db mice including TIF1γ treatment (40 μg). (C) Muscle fibre size, (D) lipid accumulation, (E) fibrosis and (F) muscle weight were assessed based on H&E and MT staining. Statistical significance was determined using a one‐way analysis of variance followed by Tukey's multiple comparison test. Data are presented as mean ± SEM. *p < 0.05 TIF1γ, transcriptional intermediary factor 1γ; MT, Masson's trichrome; H&E, haematoxylin and eosin; SEM, standard error of the mean.
FIGURE 5
FIGURE 5
Effect of TIF1γ treatment on gene expression and skeletal muscle function in db/db mice. (A) Effect of TIF1γ plasmid (40 μg) treatment on mRNA expression levels of atrophy‐related genes (Atrogin 1, Murf‐1) and (B) muscle regeneration genes (Myod1, Myf5) in quadricep muscles. Skeletal muscle functionality was evaluated using the hanging grid and forelimb grip strength tests. Statistical significance was determined using a one‐way analysis of variance followed by Tukey's multiple comparison test. Data are presented as mean ± SEM. *p < 0.05. TIF1γ, transcriptional intermediary factor 1γ; mRNA, messenger RNA; SEM, standard error of the mean.
FIGURE 6
FIGURE 6
Effect of TIF1γ treatment on myokine expression in the quadricep muscles of db/db mice. (A) mRNA expression levels of the myokines FGF‐21, BDNF and FNDC5 were analysed using qPCR. (B) Representative immunoblot images and quantitative analysis of FNDC5 protein expression. (C) Effect of TIF1γ plasmid (40 μg) treatment on serum irisin levels, measured using an ELISA. (D) Changes in serum irisin levels over time in normal male C57BL/6 mice. Statistical significance was determined using a one‐way analysis of variance followed by Tukey's multiple comparison test. Data are presented as mean ± SEM. *p < 0.05. TIF1γ, transcriptional intermediary factor 1γ; qPCR, quantitative polymerase chain reaction; Fgf‐21, fibroblast growth factor 21; BDNF, brain‐derived neurotrophic factor; SEM, standard error of the mean; mRNA, messenger RNA.
FIGURE 7
FIGURE 7
Effect of TIF1γ on irisin expression and secretion in C2C12 cells. (A & B) Experimental in vitro scheme for C2C12 differentiation. (C & D) Changes in irisin expression and secretion following TIF1γ plasmid (2 μg) transfection during C2C12 differentiation. Statistical significance was determined using a one‐way analysis of variance followed by Tukey's multiple comparison test. Data are presented as mean ± SEM. *p < 0.05. TIF1γ, transcriptional intermediary factor 1γ; C2C12, murine myoblast cells; SEM, standard error of the mean.
FIGURE 8
FIGURE 8
Effect of TIF1γ on palmitate treatment in C2C12 cells and the paracrine effect of TIF1γ‐induced irisin on palmitate‐treated HK‐2 cells. (A) Changes in irisin, TIF1γ, PGC‐1α and pAkt expression following palmitate (100 μM) treatment in the presence or absence of TIF1γ (2 μg). (B) Changes in irisin secretion following palmitate (100 μM) treatment with or without TIF1γ (2 μg). (C) Changes in EMT markers in palmitate (100 μM)‐treated HK‐2 cells induced by CM from TIF1γ‐transfected C2C12 cells. (D) Western blot analysis of FNDC5 protein levels in C2C12 cells transfected with control or FNDC5‐specific siRNAs (#1–5) for 48 h. (E) Irisin levels in CM from C2C12 cells transfected with 25 nmol siRNA‐FNDC5 and 2 μg TIF1γ, measured by ELISA. (F) Changes in EMT markers in palmitate (100 μM)‐treated HK‐2 cells induced by CM from C2C12 cells transfected with 25 nmol siRNA‐FNDC5 and TIF1γ. Each protein expression level was normalized to α‐tubulin or β‐actin (A, C, D, F). TIF1γ, transcriptional intermediary factor 1γ; HK‐2, human kidney 2 cells; C2C12, murine myoblast cells; PGC‐1α, peroxisome proliferator‐activated receptor gamma coactivator 1‐alpha; pAkt, phosphorylated protein kinase B; EMT, epithelial–mesenchymal transition; BMP‐7, bone morphogenetic protein 7; α‐SMA, alpha‐smooth muscle actin; pSmad2/3, phosphorylated Smad2/3; CM, conditioned medium; siRNA, signal interfering RNA.

References

    1. Kovesdy C. P., “Epidemiology of Chronic Kidney Disease: An Update 2022,” Kidney International. Supplement (2011) 12 (2022): 7–11. - PMC - PubMed
    1. Chen T. K., Knicely D. H., and Grams M. E., “Chronic Kidney Disease Diagnosis and Management: A Review,” Journal of the American Medical Association 322 (2019): 1294–1304. - PMC - PubMed
    1. Alicic R. Z., Rooney M. T., and Tuttle K. R., “Diabetic Kidney Disease: Challenges, Progress, and Possibilities,” Clinical Journal of the American Society of Nephrology 12 (2017): 2032–2045. - PMC - PubMed
    1. McClellan W. M. and Flanders W. D., “Risk Factors for Progressive Chronic Kidney Disease,” Journal of the American Society of Nephrology 14 (2003): S65–S70. - PubMed
    1. Tsai W. C., Wu H. Y., Peng Y. S., et al., “Risk Factors for Development and Progression of Chronic Kidney Disease: A Systematic Review and Exploratory Meta‐Analysis,” Medicine (Baltimore) 95 (2016): e3013. - PMC - PubMed