. 2025 Aug 1;148(8):2899-2911.
doi: 10.1093/brain/awaf080.

Alterations in dopaminergic innervation and receptors in focal cortical dysplasia

Affiliations

Alterations in dopaminergic innervation and receptors in focal cortical dysplasia

Norisa Meli et al. Brain. .

Abstract

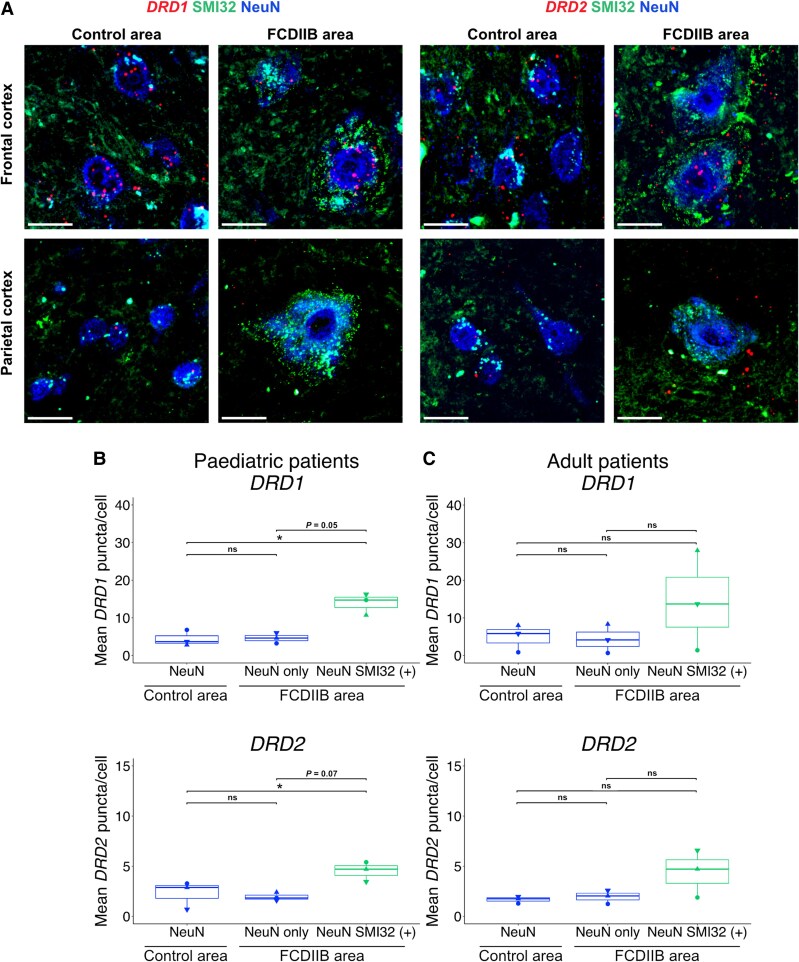
Focal cortical dysplasia (FCD) type 2 is the most common malformation of cortical development associated with pharmaco-resistant focal epilepsy and frequently located in the frontal cortex. Neuropathological hallmarks comprise abnormal cortical layering and enlarged, dysmorphic neuronal elements. Fundamentally altered local neuronal activity has been reported in human FCD type 2 epilepsy surgical biopsies. Of note, FCD type 2 emerges during brain development and forms complex connectivity architectures with surrounding neuronal networks. Local cortical microcircuits, particularly in frontal localization, are extensively modulated by monoaminergic axonal projections originating from the brainstem. Previous analysis of monoaminergic modulatory inputs in human FCD type 2 biopsies suggested altered density and distribution of these monoaminergic axons; however, a systematic investigation is still pending. Here, we perform a comprehensive analysis of dopaminergic (DA) innervation, in human FCD type 2 biopsies and in the medial prefrontal cortex (mPFC) of an FCD type 2 mouse model [mechanistic target of rapamyin (mTOR) hyperactivation model] during adolescent and adult stages. In addition, we analyse the expression of dopamine receptor transcripts via multiplex fluorescent RNA in situ hybridization in human specimens and the mPFC of this mouse model. In the mTOR hyperactivation mouse model, we observe a transient alteration of DA innervation density during adolescence and a trend towards decreased innervation in adulthood. In human FCD type 2 areas, the overall DA innervation density is decreased in adult patients compared with control areas from these patients. Moreover, the DA innervation shows an altered lamination pattern in the FCD type 2 area compared with the control area. Dopamine receptors 1 and 2 appear to be differentially expressed in the dysmorphic neurons in human samples and mTOR-mutant cells in mice compared with normally developed neurons. Intriguingly, our results suggest complex molecular and structural alterations putatively inducing impaired DA neurotransmission in FCD type 2. We hypothesize that this may have important implications for the development of these malformations and the manifestation of seizures.

Keywords: cortical malformations; epileptogenesis; neurodevelopmental disorders; neuromodulation; neurotransmitter systems.


Conflict of interest statement

The authors report no competing interests.

Figures

Figure 1
Figure 1
Altered dopaminergic (DA) innervation density and maturation in the mPFC of the p.Leu2427Pro mTOR mouse model. (A) Experimental pipeline: created in BioRender. Meli, N. (2025) https://BioRender.com/g84c358. (B) Representative images of WT-mTOR (left) and mTOR p.Leu2427Pro (right) mPFC immunostained for TH, GFP and RFP. Bottom: Higher magnification of TH+ axons in the boxed regions in the top panels. Scale bar = 200 μm. (C) Quantification of DA axonal density at P30 (n = 7, Mann–Whitney–Wilcoxon test for upper layer and t-test for deeper layer). (D) Quantification of DA axonal density at P60 (n = 5, t-test). (E) Comparison of DA density quantification between time points in the upper (left) and deeper (right) layers (Kruskal–Wallis test with post hoc Dunn's test with Bonferroni adjustments for multiple comparisons). Occupation index is calculated as the percentage of the area covered by axons in each layer divided by the total area of that layer. The data-points in the box plots represent the mean occupational index for each biological replicate, while the median value is indicated by the horizontal line within the box plot. E = embryonic day; GFP = green fluorescent protein; mPFC = medial prefrontal cortex; mTor = mechanistic target of rapamycin; P = postnatal; RFP = red fluorescent protein; TH = tryosine hydroxylase.
Figure 2
Figure 2
Drd1 and Drd2 expression is upregulated in neurons with the p.Leu2427Pro mTOR mutation. (A) Representative images of FISH for Drd1 (left) and Drd2 (right) in combination with NeuN and GFP or RFP immunostaining in the upper and deeper layers of WT-mTOR and p.Leu2427Pro mPFC at P30. Scale bar = 20 μm. (BE) Quantification of Drd1 (B and D) and Drd2 (C and E) mRNA expression levels in different groups of neurons in P30 (B and C) and P60 (D and E) WT and p.Leu2427Pro mPFC. Groups in WT-mTOR mPFC: RFP (−): non-electroporated, NeuN+ neurons; RFP (+): neurons electroporated with WT-mTOR plasmid, NeuN+. Groups in p.Leu2427Pro mPFC: GFP (−): non-electroporated, NeuN+ neurons; GFP (+): neurons electroporated with mTOR-pLeu2427Pro plasmid, NeuN+. Number of neurons quantified for Drd1 analysis at P30: upper layers: 508 RFP (−), 125 RFP (+), 578 GFP (−), 60 GFP (+), deeper layers: 1069 RFP (−), 571 GFP (−), 83 GFP (+). Number of neurons quantified for Drd2 analysis at P30: upper layers: 572 RFP (−), 124 RFP (+), 527 GFP (−), 69 GFP (+), deeper layers: 1073 RFP (−), 607 GFP (−), 66 GFP (+). Number of neurons quantified for Drd1 analysis at P60: upper layers: 1123 RFP (−), 88 RFP (+), 1081 GFP (−), 53 GFP (+), deeper layers: 1912 RFP (−), 1231 GFP (−), 60 GFP (+). Number of neurons quantified for Drd2 analysis at P60: upper layers: 1303 RFP (−), 98 RFP (+), 1069 GFP (−), 72 GFP (+), deeper layers: 1805 RFP (−), 971 GFP (−), 72 GFP (+). P30: n = 3 mice per group, P60: n = 4 mice per group. Upper layers: two-way ANOVA with repeated measures to compare within experimental groups followed by Bonferroni test to correct for multiple comparisons between the indicated groups. Deeper layers: paired t-test to compare GFP (−) versus GFP (+) groups within the p.Leu2427Pro experimental group and unpaired t-test to compare between other groups. P-values were adjusted for multiple comparisons using the Bonferroni–Dunn method. The data points in the boxplots represent the mean puncta/cell expression for each biological replicate, while the median value is indicated by the horizontal line within the boxplot. Drd1 = dopamine receptor D1; Drd2 = dopamine receptor D2; FISH = multiplex fluorescent in situ hybridization; GFP = green fluorescent protein; mPFC = medial prefrontal cortex; mTOR = mechanistic target of rapamycin; NeuN = neuronal nuclei marker; P = postnatal; RFP = red fluorescent protein.
Figure 3
Figure 3
Characterization of control and FCD type 2b areas in human specimens of FCD type 2b patients. (A) Experimental pipeline: created in BioRender. Meli, N. (2025) https://BioRender.com/z47q234. (B) Identification of control and FCD type 2b (FCDIIB) areas within the biopsied tissue. Example images for one patient biopsy. Left: Control (blue box, right) and FCDIIB (red box, left) are defined based on immunostaining for NeuN. Scale bar = 1000 μm. Right: Higher magnification of a region in the FCD type 2b area (indicated by the white box in the left panel) immunostained for SMI32 and NeuN. SMI32 is expressed in dysmorphic neurons (white arrows). Scale bar = 50 μm. (C) Higher magnification of control and FCD type 2b areas indicated with the blue and red boxes from the left panel in B. Division in upper, middle and deeper layers is indicated. FCD = focal cortical dysplasia; NeuN = neuronal nuclei marker; SMI32 = neurofilament H (antibody, clone SMI32).
Figure 4
Figure 4
Altered laminar distribution of dopaminergic (DA) axons and changes in the density of axonal varicosities in the FCD type 2b areas of human specimens. (A) Top: 3D reconstruction of DA axonal tracings in control and FCD type 2b (FCDIIB) areas across the upper, middle and deeper layers. Reconstruction of a total of seven serial sections from one adult patient (frontal cortex). Scale bar = 500 μm. Bottom left: Higher magnification of boxed area in control region of the top panel showing example traces of TH axons in serial sections. Yellow and green axons were traced in one section, while the white axon was traced in an adjacent section. Bottom right: Example of varicosities (arrowheads) detected in one TH axon. Scale bar = 10 μm. (B and C) Quantification of DA axonal density (B) and varicosity density along the axons (C) in the entire control and FCD type 2b area. (D and E) Separate quantification of DA axonal density (D) and varicosity density along the axons (E) in upper, middle and deeper layers in control and FCD type 2b areas from paediatric and adult patients. Occupation index is calculated as percentage of total axonal length for each analysed area normalized for the total area. n = 3 specimen for paediatric and for adult patients, paired t-test. The data signs in the box plots represent the mean value for each biological replicate, while the median value is indicated by the horizontal line within the box plot. Symbols: filled downward triangle, filled upward triangle = frontal cortex; filled circle = parietal cortex. FCD = focal cortical dysplasia; TH = tyrosine hydroxylase.
Figure 5
Figure 5
DRD1 and DRD2 expression is upregulated in dysmorphic neurons in FCD type 2b cortical areas of paediatric and adult patients. (A) Representative images of FISH for DRD1 (left) and DRD2 (right) in control and FCD type 2b (FCDIIB) areas of adult frontal and parietal cortex. Scale bar = 20 μm. (B) Expression analysis of DRD1 and DRD2 mRNA in paediatric human FCD specimen. Quantified cells for DRD1: 105 NeuN, 39 NeuN only, 26 NeuN SMI32 (+). DRD2: 110 NeuN, 37 NeuN only, 31 NeuN SMI32 (+). (C) Expression analysis of DRD1 and DRD2 mRNA in adult human FCD type 2b specimen. Quantified cells for DRD1: 213 NeuN, 101 NeuN only, 42 NeuN SMI32 (+). DRD2: 289 NeuN, 100 NeuN only, 38 NeuN SMI32 (+). n = 3 specimen for paediatric and for adult patients, one-way ANOVA with repeated measures followed by Tukey's test for multiple comparisons between groups. The data signs in the box plots represent the mean puncta/cell expression for each biological replicate, while the median value is indicated by the horizontal line within the box plot. Symbols: filled downward triangle, filled upward triangle = frontal cortex; filled circle = parietal cortex. DRD1 = dopamine receptor D1; DRD2 = dopamine receptor D2; FCD = focal cortical dysplasia; FISH = multiplex fluorescent in situ hybridization; NeuN = neuronal nuclei marker; SMI32 = neurofilament H (antibody clone SMI32).

References

    1. Blümcke I, Thom M, Aronica E, et al. The clinicopathologic spectrum of focal cortical dysplasias: A consensus classification proposed by an ad hoc task force of the ILAE diagnostic methods commission. Epilepsia. 2011;52:158–174. - PMC - PubMed
    1. Baldassari S, Picard F, Verbeek NE, et al. The landscape of epilepsy-related GATOR1 variants. Genet Med. 2019;21:398–408. - PMC - PubMed
    1. Najm I, Lal D, Alonso Vanegas M, et al. The ILAE consensus classification of focal cortical dysplasia: An update proposed by an ad hoc task force of the ILAE diagnostic methods commission. Epilepsia. 2022;63:1899–1919. - PMC - PubMed
    1. Auvin S, Baulac S. mTOR-therapy and targeted treatment opportunities in mTOR-related epilepsies associated with cortical malformations. Rev Neurol (Paris). 2023;179:337–344. - PubMed
    1. Cepeda C, Hurst RS, Flores-Hernández J, et al. Morphological and electrophysiological characterization of abnormal cell types in pediatric cortical dysplasia. J Neurosci Res. 2003;72:472–486. - PubMed

MeSH terms

Substances

Supplementary concepts