

Inequity of NIH cancer funding in the United States: an ecological study predicting funding based on disease burden from 2008 through 2023
- PMID: 40235553
- PMCID: PMC11999525
- DOI: 10.1016/j.lana.2025.101081
Inequity of NIH cancer funding in the United States: an ecological study predicting funding based on disease burden from 2008 through 2023
Abstract
Background: Disease burden has been used to predict National Institutes of Health (NIH) funding but included diseases with little underlying relationship. Here we focus on cancers to create a more appropriate model to allow for more targeted scrutinization of funding allocation.
Methods: An ecological study using NIH funding data (2008-2023) was performed. Inclusion of cancers was based on their presence in the NIH Research Portfolio Online Reporting Tool and the 2021 Global Burden of Disease (GBD) study. Disability-adjusted life years (DALY) were collected and to evaluate the impact of public interest, Google Trends data was used. Multivariable linear regression determined appropriate funding based on disease burden and public interest. To quantify how each cancer's funding differed from model predictions residual values were used to calculate the percent over/under funding.
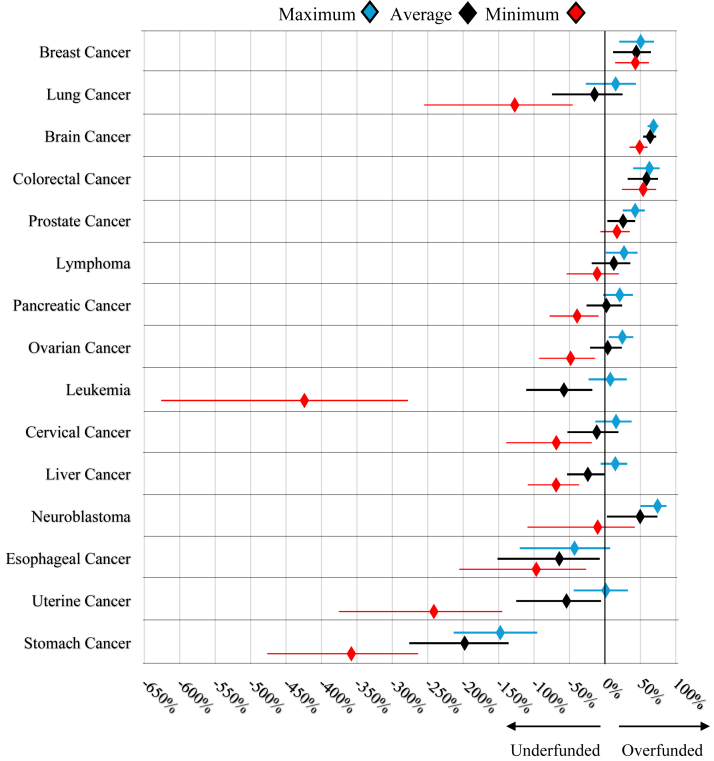
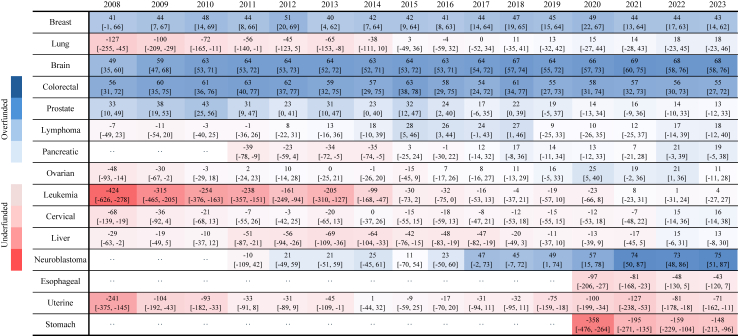
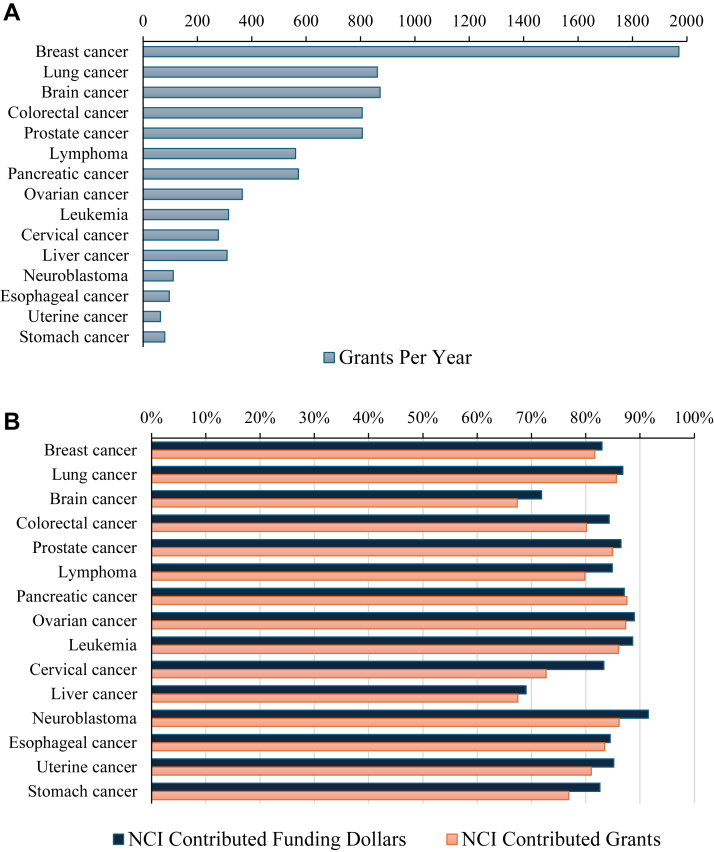
Findings: Fifteen cancers met inclusion criteria. Neuroblastoma had the greatest ratio of funding to DALYs per 100,000 people (US$14,000,000) while lung cancer had the lowest (US$300,000). Stomach cancer was the most underfunded (197.9% [95% CI: 136.0%, 276.2%]) while brain cancer was the most overfunded (64.1% [95% CI: 53.8%, 72.1%]). Even at their lowest funding values in the study period brain, breast, and colorectal cancer all had greater than 40% overfunding. Contrarily, the lowest annual funding for leukemia, uterine, and stomach cancer received less than 150% of expected funding. Despite its overfunding brain cancer had an increase in DALYs in the study period.
Interpretation: Modeling by disease category demonstrated disparities in funding indicating the need for reevaluation for possible funding inequities. The year-by-year approach taken in this study will drive the ability for future research to better understand NIH funding decisions. Additionally, the role of public interest in research funding needs to be further evaluated to ensure that popularity does not override disease burden, in funding decisions.
Funding: No Funding.
Keywords: Burdens of disease; Cancer; DALY; Equity; Global health; Grant funding; Health disparity; Health economics; Health policy; Medical ethics; NIH; National institute of health; Research funding.
© 2025 The Author(s).
Conflict of interest statement
None to declare.
Figures
Similar articles
-
Correlation Between National Institutes of Health Funding for Pediatric Research and Pediatric Disease Burden in the US.JAMA Pediatr. 2021 Dec 1;175(12):1236-1243. doi: 10.1001/jamapediatrics.2021.3360. JAMA Pediatr. 2021. PMID: 34515752 Free PMC article.
-
Musculoskeletal health: an ecological study assessing disease burden and research funding.Lancet Reg Health Am. 2024 Jan 8;29:100661. doi: 10.1016/j.lana.2023.100661. eCollection 2024 Jan. Lancet Reg Health Am. 2024. PMID: 38225979 Free PMC article.
-
Exploring static and dynamic relationships between burden of disease and research funding in the United States.Health Res Policy Syst. 2022 Jun 3;20(1):60. doi: 10.1186/s12961-022-00837-y. Health Res Policy Syst. 2022. PMID: 35659236 Free PMC article.
-
Global, regional, and national burden of 12 mental disorders in 204 countries and territories, 1990-2019: a systematic analysis for the Global Burden of Disease Study 2019.Lancet Psychiatry. 2022 Feb;9(2):137-150. doi: 10.1016/S2215-0366(21)00395-3. Epub 2022 Jan 10. Lancet Psychiatry. 2022. PMID: 35026139 Free PMC article.
-
The Minderoo-Monaco Commission on Plastics and Human Health.Ann Glob Health. 2023 Mar 21;89(1):23. doi: 10.5334/aogh.4056. eCollection 2023. Ann Glob Health. 2023. PMID: 36969097 Free PMC article. Review.
References
-
- NIH . National Institutes of Health (NIH); 2019. Grants & funding.https://www.nih.gov/grants-funding Available from:
-
- National Institute of Health . National Institute of Health; 2020. RePORT. report.nih.gov.https://report.nih.gov/funding/categorical-spending#/ [cited 2024 Jul 31]. Available from:
-
- NIH Research Planning . U.S. Department of Health and Human Services; 2015. National institutes of health (NIH)https://www.nih.gov/about-nih/nih-research-planning [cited 2024 Jul 31]. Available from:
-
- Gross C.P., Anderson G.F., Powe N.R. The relation between funding by the national institutes of health and the burden of disease. N Engl J Med. 1999;340(24):1881–1887. - PubMed
LinkOut - more resources
Full Text Sources
Miscellaneous
