. 2025 Mar 17;28(4):112226.
doi: 10.1016/j.isci.2025.112226. eCollection 2025 Apr 18.

Normalization and cross-entropy connectivity in brain disease classification

Affiliations

Normalization and cross-entropy connectivity in brain disease classification

Haifeng Wu et al. iScience. .

Abstract

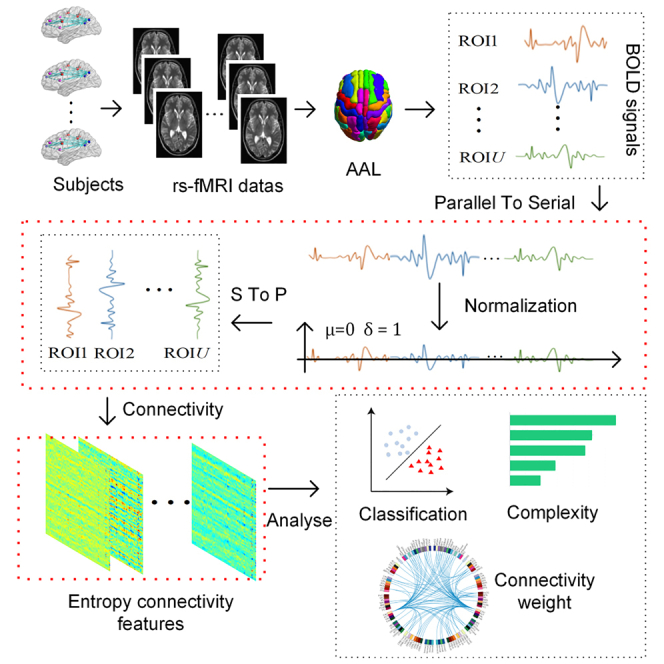
In resting-state functional magnetic resonance imaging (rs-fMRI), Pearson correlation has traditionally been the dominant method for constructing brain connectivity. This paper introduces an entropy-based connectivity approach utilizing subject-level Z score normalization, which not only standardizes signal amplitudes across subjects but also preserves interregional signal differences more effectively than Pearson correlation. Furthermore, the proposed method incorporates cross-entropy techniques, offering an advanced perspective on the temporal ordering of signals between brain regions rather than merely capturing their synchronization. Experimental results demonstrate that the proposed subject-normalized cross-joint entropy achieves superior classification accuracy in schizophrenia, mild cognitive impairment, and autism spectrum disorder, outperforming the conventional normalized correlation method by approximately 4%, 6%, and 7%, respectively. Additionally, the observed performance improvement may be attributed to changes in the symmetry of functional connectivity between brain regions-an aspect often overlooked in traditional functional connectivity analyses.

Keywords: Biocomputational method; Mathematical biosciences; Neuroscience.


Conflict of interest statement

The authors declare no competing interests.

Figures

None
Graphical abstract
Figure 1
Figure 1
The average classification accuracy of each normalized cross-entropy (including correlation) across the three diseases of SCZ, MCI, and ASD is determined by combining 5 normalization methods and 10 cross-entropy measures, respectively (A) SCZ classification accuracy. (B) MCI classification accuracy. (C) ASD classification accuracy.
Figure 2
Figure 2
Histogram depicting the average running times (unit:s) of different normalized cross-entropy methods obtained across three pathologies
Figure 3
Figure 3
Within ASD, MCI, and SCZ, the ROIs with high-weighted connectivities to PCC are shown
Figure 4
Figure 4
Sub_N+CJE and Pearson connectivity weights in SCZ (A) SCZ Connection weights calculated by ReliefF under Sub_N+CJE method. (B) SCZ Connection weights calculated by Chi2 under Sub_N+CJE method. (C) SCZ Connection weights calculated by ReliefF under Pearson correlation method. (D) SCZ Connection weights calculated by Chi2 under Pearson correlation method.
Figure 5
Figure 5
Sub_N+CJE and Pearson connectivity weights in MCI (A) MCI Connection weights calculated by ReliefF under Sub_N+CJE method. (B) MCI Connection weights calculated by Chi2 under Sub_N+CJE method. (C) MCI Connection weights calculated by ReliefF under Pearson correlation method. (D) MCI Connection weights calculated by Chi2 under Pearson correlation method.
Figure 6
Figure 6
Sub_N+CJE and Pearson connectivity weights in ASD (A) ASD Connection weights calculated by ReliefF under Sub_N+CJE method. (B) ASD Connection weights calculated by Chi2 under Sub_N+CJE method. (C) ASD Connection weights calculated by ReliefF under Pearson correlation method. (D) ASD Connection weights calculated by Chi2 under Pearson correlation method.
Figure 7
Figure 7
The proportion of ROI symmetric connectivities is presented for Sub_N+CJE across different significance levels in SCZ
Figure 8
Figure 8
The proportion of ROI symmetric connectivities is presented for Sub_N+CJE across different significance levels in MCI
Figure 9
Figure 9
The proportion of ROI symmetric connectivities is presented for Sub_N+CJE across different significance levels in ASD
Figure 10
Figure 10
Linear and Z Score normalization methods
Figure 11
Figure 11
Pearson correlation is examined under three conditions (A) Between two synchronous ROI signals, yielding a correlation value of 1. (B) Between two ROI signals with a quarter-cycle time difference (where in one ROI signal contains noise), resulting in a correlation value of 0. (C) Between an ROI signal and noise, also yielding a correlation value of 0.
Figure 12
Figure 12
Flow chart of subject normalization algorithm
Figure 13
Figure 13
Cross-joint entropy is exampled across three scenarios (A) Between two synchronized ROI signals, yielding the lowest joint entropy. (B) Between two ROI signals with a one-quarter period time difference (one ROI signal containing noise), resulting in the second lowest joint entropy. (C) Between an ROI signal and noise, with the joint entropy being the highest.
Figure 14
Figure 14
Three symmetrical patterns of brain connectivity "A-D" denotes only the connection points in the graph; for instance, "A-B" represents the connection between point A and point B. The detailed description of the figure is included in the experimental methods and classification section.

Similar articles

References

    1. Horwitz B. The elusive concept of brain connectivity. Neuroimage. 2003;19:466–470. doi: 10.1016/S1053-8119(03)00112-5. - DOI - PubMed
    1. Gergelyfi M., Sanz-Arigita E.J., Solopchuk O., Dricot L., Jacob B., Zénon A. Mental fatigue correlates with depression of task-related network and augmented DMN activity but spares the reward circuit. Neuroimage. 2021;243 doi: 10.1016/j.neuroimage.2021.118532. - DOI - PubMed
    1. Stöffel T., Vaqué-Alcázar L., Bartrés-Faz D., Peró-Cebollero M., Cañete-Massé C., Guàrdia-Olmos J. Reduced default mode network effective connectivity in healthy aging is modulated by years of education. Neuroimage. 2024;288 doi: 10.1016/j.neuroimage.2024.120532. - DOI - PubMed
    1. Jolles D.D., Mennigen E., Gupta M.W., Hegarty C.E., Bearden C.E., Karlsgodt K.H. Relationships between intrinsic functional connectivity, cognitive control, and reading achievement across development. Neuroimage. 2020;221 doi: 10.1016/j.neuroimage.2020.117202. - DOI - PubMed
    1. Pauleit D., Stoffels G., Bachofner A., Floeth F.W., Sabel M., Herzog H., Tellmann L., Jansen P., Reifenberger G., Hamacher k., et al. Comparison of 18F-FET and 18F-FDG PET in brain tumors. Nucl. Med. Biol. 2009;36:779–787. doi: 10.1016/j.nucmedbio.2009.05.005. - DOI - PubMed

LinkOut - more resources