. 2025 Mar 13;28(4):112171.
doi: 10.1016/j.isci.2025.112171. eCollection 2025 Apr 18.

Hippocampal and cortical high-frequency oscillations orchestrate human semantic networks during word list memory

Affiliations

Hippocampal and cortical high-frequency oscillations orchestrate human semantic networks during word list memory

Akash Mishra et al. iScience. .

Abstract

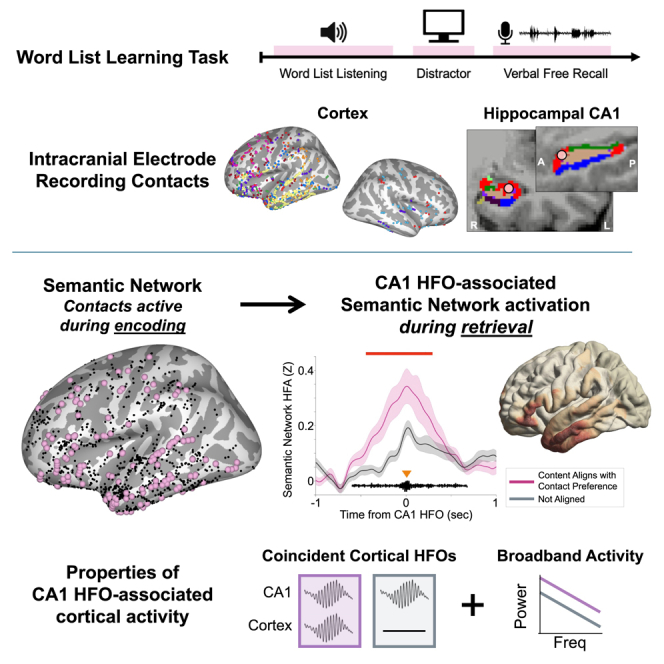
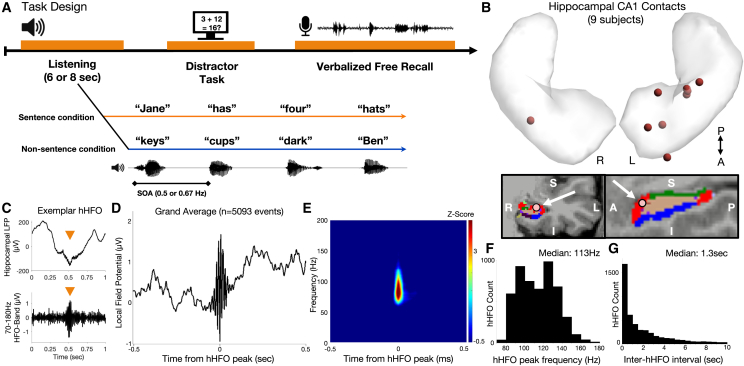
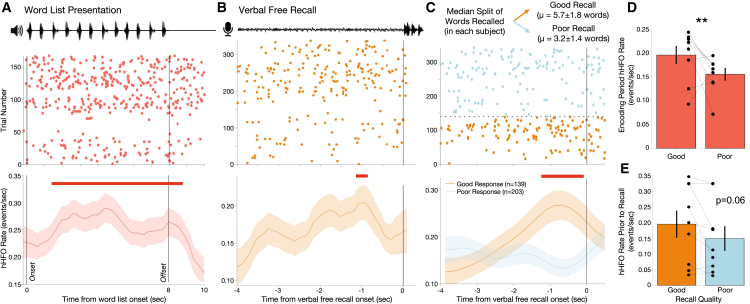
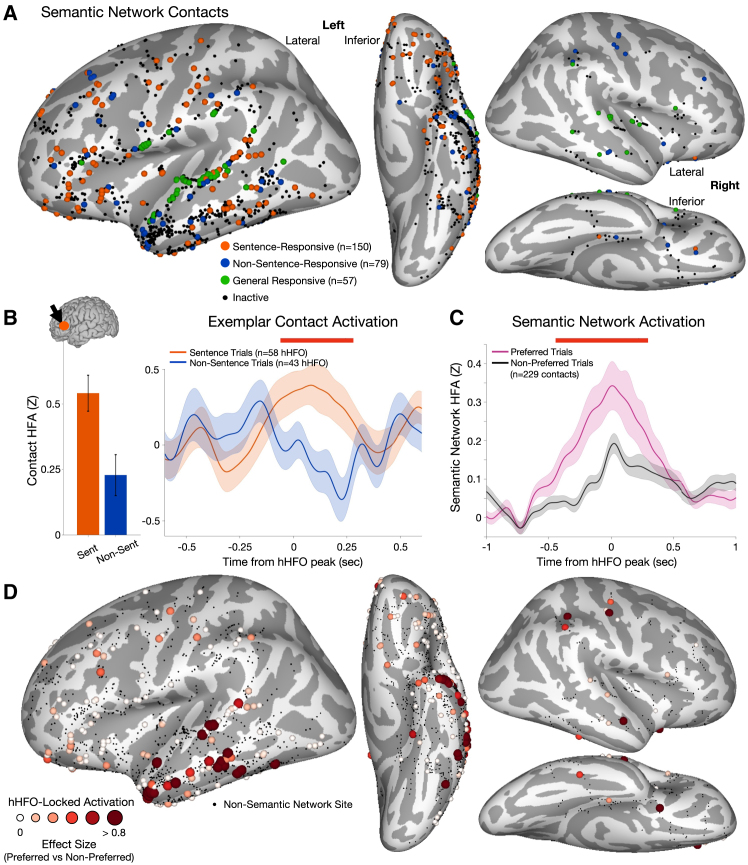
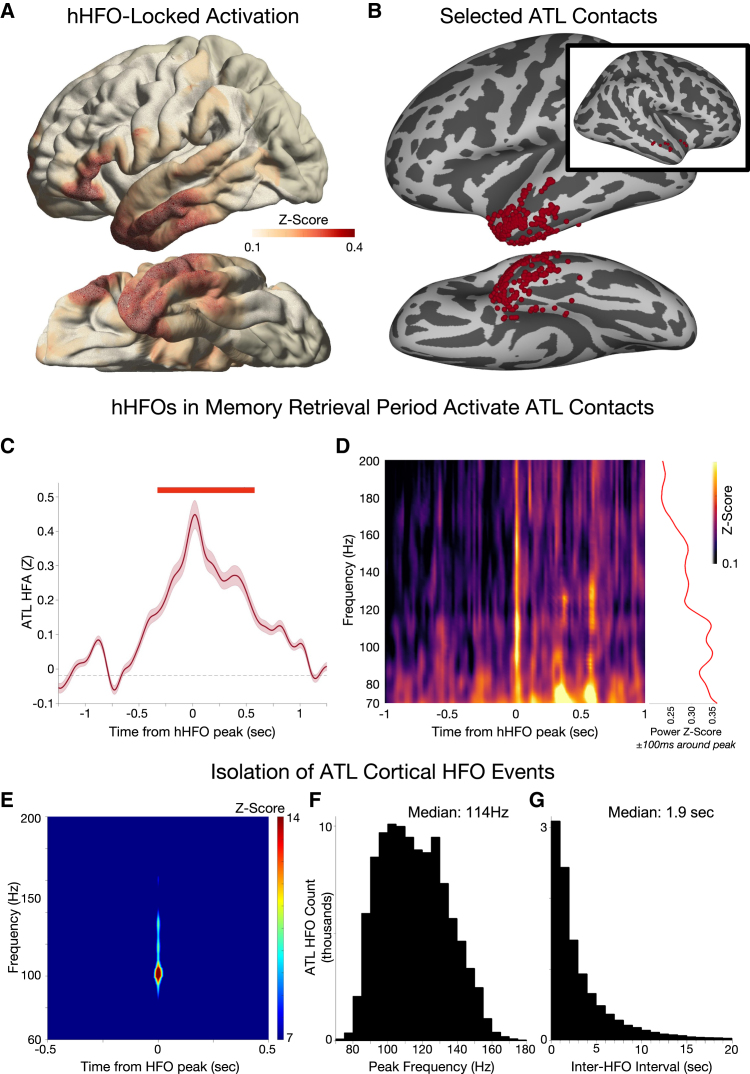
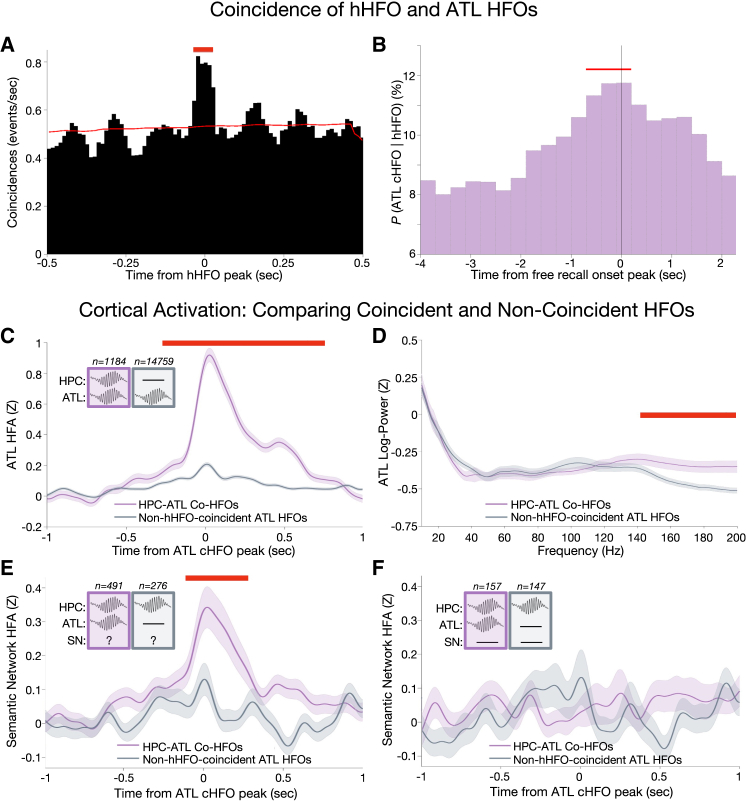
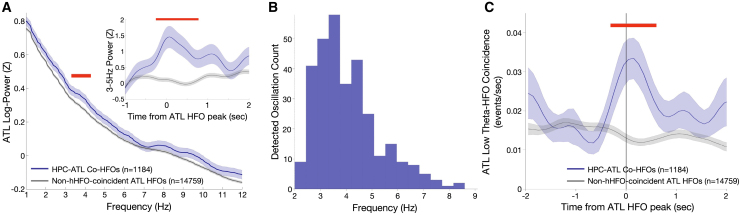
Episodic memory requires the precise coordination between the hippocampus and distributed cortical regions. This may be facilitated by bursts of brain activity called high-frequency oscillations (HFOs). We hypothesized that HFOs activate specific networks during memory retrieval and aimed to describe the electrophysiological properties of HFO-associated activity. To study this, we recorded intracranial electroencephalography while human participants performed a list learning task. Hippocampal HFOs (hHFOs) increased during encoding and retrieval, and these increases correlated with memory performance. During retrieval, hHFOs demonstrated activation of semantic processing regions that were previously active during encoding. This consisted of broadband high-frequency activity (HFA) and cortical HFOs. HFOs in the anterior temporal lobe, a major semantic hub, co-occurred with hHFOs, particularly during retrieval. These coincident HFOs were associated with greater cortical HFA and cortical theta bursts. Hence, HFOs may support synchronization of activity across distributed nodes of the hippocampal-cortical memory network.

Keywords: Cognitive neuroscience; Linguistics.


Conflict of interest statement

The authors declare no competing interests.

Figures

None
Graphical abstract
Figure 1
Figure 1
Experimental design and hippocampal high-frequency oscillation (hHFO) detection (A) Experimental design and example stimuli presented to participants. Participants listened to a list of 12 words assembled into either 3 sentences (of 4 words each) or a randomized word list. Then, after an arithmetic distractor task, participants were asked to freely recall as many words as possible. Sentence and non-sentence trials were randomized and interleaved for a total of 30 trials. (B) (Top) Hippocampal depth electrode selection across all participants. One point represents an individual participant. (Bottom) Representative structural reconstruction of hippocampal depth electrodes in one participant in coronal (left) and sagittal (right) views; white arrows denote CA1 recording site implemented for hHFO detection analysis. Red parcellation indicates CA1 subregion. (See Figure S2 for similar reconstructions for other participants). (C) Example of hHFOs as they appear in (top) the raw hippocampal local field potential and (bottom) the 70–180 Hz frequency range. (D) Grand average peri-hHFO field potential locked to hHFO peak for n = 5,093 HFOs from nine participants. (E) Wavelet spectrogram locked to hHFO peak for n = 885 hHFOs from one representative participant. Warmer colors indicate a higher spectral power in that frequency-time combination. (F) Distribution of hHFO peak frequencies and (G) inter-hHFO interval for n = 5,093 hHFOs from nine participants.
Figure 2
Figure 2
Hippocampal high-frequency oscillation (hHFO) dynamics during word list presentation and free recall (A) hHFO raster plot and peri-event time histogram (PETH) time-locked to the onset of word list presentation (n = 168 trials across 7 participants), depicting a sustained increase in hHFO rate in response to word list presentation compared to baseline that subsequently diminishes after offset of word presentation (vertical line). Two participants were removed from this analysis due to variation in word presentation frequency but demonstrated a similar hHFO rate increase (Figure S3). Red line indicates significance at p < 0.05 (permutation test compared to shuffled hHFO times in the 2-s post-trial resting period). Shaded areas represent one bootstrap standard error computed over hHFO events. (B) hHFO raster plot and PETH time-locked to the onset of distinct recall vocalizations (n = 338 trials across 9 participants), indicating a transient response-locked increase in hHFO rate. Red line indicates significance at p < 0.05 (permutation test shuffling hHFO times across this PETH epoch). Shaded areas represent one bootstrap standard error computed over hHFO events. (C) hHFO raster plot and PETH time-locked to onset of distinct recall vocalizations. Data are median split by the number of words recalled during that trial where “good response” (n = 139 trials) was a trial where the participant recalled more than their median number of recalled words across trials and a “poor response” was equal to or below the median (n = 203 trials). Red line denotes significance at p < 0.05 (cluster-based permutation test clustering across time, p < 0.05). Shaded areas represent one bootstrap standard error computed over hHFO events. (D) Mean hHFO rate during the encoding phase for trials that contained a good response and poor response. Each point represents the mean hHFO rate per participant, and lines connect data for each participant. Error bar depicts standard deviation across participant. Stars denote significance at p < 0.05 (Mann-Whitney U test). (E) Mean hHFO rate during the 2 s window prior to onset of verbal free recall in trials that contained a good response and poor response. Each point represents the mean hHFO rate per participant, and lines connect data for each participant. Error bar depicts standard deviation across participants.
Figure 3
Figure 3
Hippocampal high-frequency oscillation (hHFO)-locked activation of the semantic network (A) Left lateral (left), left inferior (middle), right lateral (right upper), and right inferior (right lower) views on inflated brains of locations of sentence-responsive (orange, n = 150), non-sentence-responsive (blue, n = 79), and general semantic-responsive (green, n = 57) contacts on an inflated brain. (Also see increase in HFA during preferential word list presentation in Figure S6). (B) Peri-hHFO HFA responses in an exemplar electrode. (Left) HFA response during word presentation by sentence (Sent) and non-sentence (Non-Sent) trial (n = 15 trials and n = 180 words each; error bars denote standard deviation across trials, stars denote significance at p < 0.05, Wilcoxon rank-sum test); (inset) location of the selected electrode; (right) HFA response locked to hHFOs that occurred in the recall period when participants recalled words from either sentence (n = 58 hHFOs) or non-sentence trials (n = 43 hHFOs). Red bar represents significant time bins at p < 0.05 (cluster-based permutation test clustering across time). Shaded areas represent one standard error computed over hHFO events. (C) HFA time-locked to peak of hHFO events that occurred during recall of trials that aligned with the contact’s preference as compared to when they did not. Red line denotes significant time bins at p < 0.05 (cluster-based permutation test, n = 212 bipoles). Shaded areas represent one standard error computed across contacts. (Also see spectrogram of this analysis in Figure S8). (D) Activation effect size (in Cohen’s d) for semantic network contacts (combining sentence-responsive and non-sentence-responsive contacts) comparing peri-hHFO HFA activation during the recall period of preferred versus non-preferred trials. Darker colors and larger electrode sizes depict larger effect sizes.
Figure 4
Figure 4
Properties of anterior temporal lobe (ATL) cortical high-frequency oscillations (A) Left lateral (top) and left inferior (bottom) views of normalized brains with overlaid heatmap representing regions of increased HFA increase locked to peaks of hippocampal high-frequency oscillations (hHFOs) within the recall period across all contacts. Darker colors represent increased HFA, and uncolored regions represent no electrode coverage in the region. (B) Left lateral (top), left inferior (bottom), and right lateral (inset) views on inflated brains depicting the location of n = 196 anterior temporal lobe contacts across participants. Contacts were selected on participant-specific imaging, and precise location may be distorted in the transfer to standardized space. (C) Increase in HFA, locked to peaks of hHFOs within the recall period for n = 196 ATL contacts. Red line denotes significant time bins at p < 0.05 (cluster-based permutation test against pre-hHFO baseline). Shaded areas represent one standard error computed across ATL contacts. (D) (Left) Wavelet spectrogram of ATL high-frequency power locked to hHFOs alongside (right) mean power in the 40 ms window centered around hHFO peak for each frequency represented in the spectrogram depicting an increase in the 90–120 Hz range. Warmer colors represent increased power. (E) Wavelet spectrogram time locked to ATL HFO peak (n = 7,773 events from one participant with n = 12 ATL contacts). Warmer colors indicate a higher spectral power in that frequency-time combination. (F) Distribution of peak frequencies and (G) and inter-HFO duration for all detected ATL HFOs (n = 108,510 events in n = 196 contacts across n = 9 participants).
Figure 5
Figure 5
High-frequency oscillation (HFO)-locked activity across the hippocampus (HPC), anterior temporal lobe (ATL), and other semantic areas (SN) (A) Cross-correlograms between ATL HFOs (n = 15,943 across n = 196 ATL contacts) and hippocampal HFOs (hHFOs) (n = 772 across n = 9 hippocampal contacts) within the recall period across n = 9 participants. Red line denotes significant time bins at p < 0.05 (permutation test with jittered ATL HFO timing), indicating high coincidence. (B) Joint probability of coincident hippocampal-ATL co-HFO as a function of time relative to verbal recall onset. Red line denotes significant time bins at p < 0.05 (permutation test with jittered cortical HFO timing). A significant increase is present within 1 s window prior to verbal recall onset. (C) ATL HFA locked to peak of ATL HFO in the recall period separated by whether the ATL HFO was coincident with an hHFO (n = 1184) or not (n = 14759). Red line denotes significant time bins at p < 0.05 (cluster-based permutation test). Shaded area represents standard error computed across ATL HFO events. (See spectral profile of this difference in Figure S11). (D) High-frequency spectral profile of ATL HFOs in the recall period that were associated with hHFOs compared to that are not coincident with hHFOs. Red line denotes significant frequencies at p < 0.05 (cluster-based permutation test). Shaded area represents one standard error computed across ATL HFO events. (E) HFA in semantic network contacts, locked to peaks of hHFOs in the recall period by whether the hHFO was associated with an ATL HFO (n = 491) or not associated (n = 276). Red line denotes significant time bins at p < 0.05 (cluster-based permutation test). Shaded areas represent one standard error computed across HFO events. (F) Same as in (E) but with all hHFO epochs containing a coincident semantic network HFO removed. Shaded areas represent one standard error computed across HFO events.
Figure 6
Figure 6
Relationship between cortical HFOs and theta oscillations (A) Low-frequency spectral profile of anterior temporal lobe (ATL) activity locked to peak of ATL HFOs that were coincident (co-HFO; n = 1,184) and not coincident with an hHFO (n = 14,759). Red line denotes significant frequencies at p < 0.05 (cluster-based permutation test). Shaded areas represent one standard error across ATL HFO events. (Inset) Power in the 3–5 Hz low theta frequency range across time when locked to peak of ATL HFOs occurring in the recall period. Red line denotes significant time bins at p < 0.05 (cluster-based permutation test). Shaded areas represent one standard error across ATL HFO events. (B) Distribution of peak frequency of detected low-frequency oscillations around ATL HFOs that were coincident with an hHFO. (C) Cross-correlograms between peak of ATL HFOs that were coincident with hHFOs during the recall period and peak of ATL theta oscillations. Red line denotes significant time bins at p < 0.05 (cluster-based permutation test); 3–5 Hz oscillations occurred at a peak lag of 109 ms relative to coincident ATL HFOs. Shaded areas represent one standard error computed across cortical 3–5 Hz peak events.

Similar articles

Cited by

References

    1. Kucewicz M.T., Cimbalnik J., Garcia J.S.S., Brazdil M., Worrell G.A. High frequency oscillations in human memory and cognition: a neurophysiological substrate of engrams? Brain. 2024;147:2966–2982. doi: 10.1093/brain/awae159. - DOI - PMC - PubMed
    1. Buzsáki G., Silva F.L. High frequency oscillations in the intact brain. Prog. Neurobiol. 2012;98:241–249. doi: 10.1016/j.pneurobio.2012.02.004. - DOI - PMC - PubMed
    1. Norman Y., Yeagle E.M., Khuvis S., Harel M., Mehta A.D., Malach R. Hippocampal sharp-wave ripples linked to visual episodic recollection in humans. Science. 2019;365 doi: 10.1126/science.aax1030. - DOI - PubMed
    1. Buzsáki G. Two-stage model of memory trace formation: A role for “noisy” brain states. Neuroscience. 1989;31:551–570. doi: 10.1016/0306-4522(89)90423-5. - DOI - PubMed
    1. Vaz A.P., Inati S.K., Brunel N., Zaghloul K.A. Coupled ripple oscillations between the medial temporal lobe and neocortex retrieve human memory. Science. 2019;363:975–978. doi: 10.1126/science.aau8956. - DOI - PMC - PubMed

LinkOut - more resources