. 2025 Apr 15:8:0662.
doi: 10.34133/research.0662. eCollection 2025.

Early Growth Response Gene 1 Benefits Autoimmune Disease by Promoting Regulatory T Cell Differentiation as a Regulator of Foxp3

Affiliations

Early Growth Response Gene 1 Benefits Autoimmune Disease by Promoting Regulatory T Cell Differentiation as a Regulator of Foxp3

Liu Yang et al. Research (Wash D C). .

Abstract

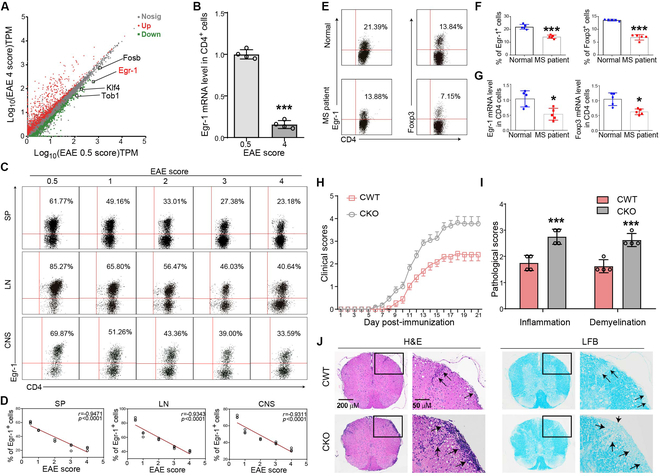
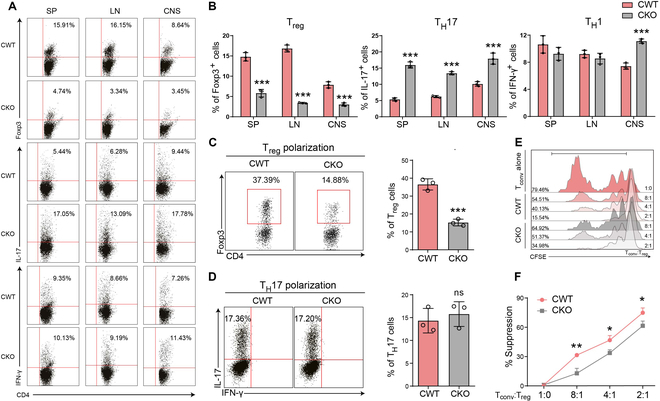
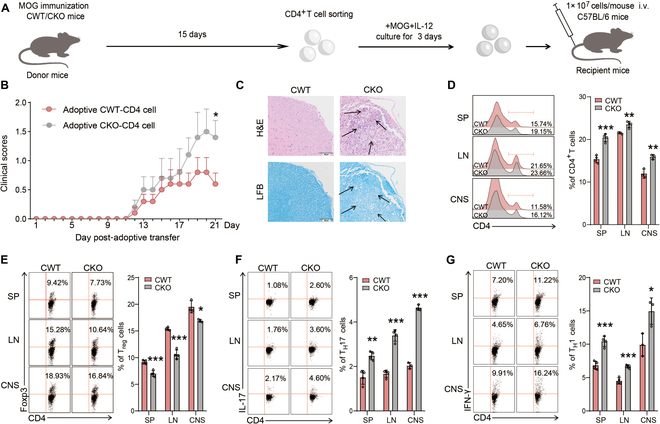
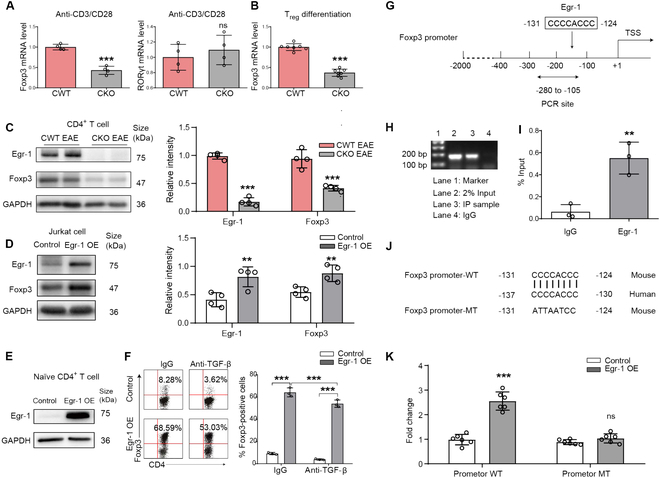
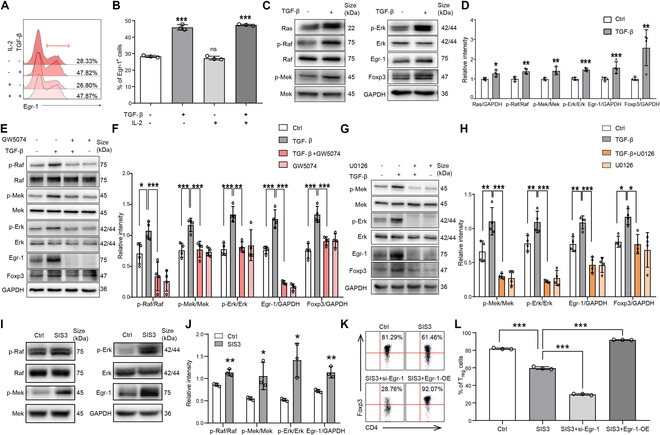
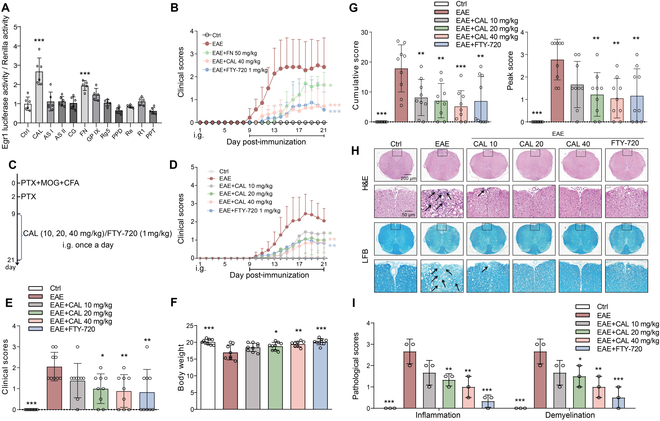
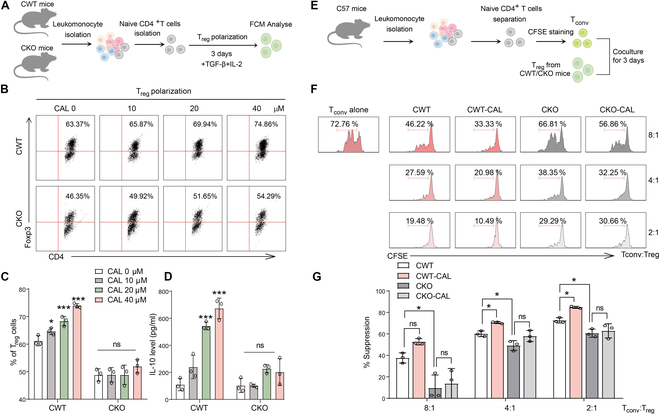
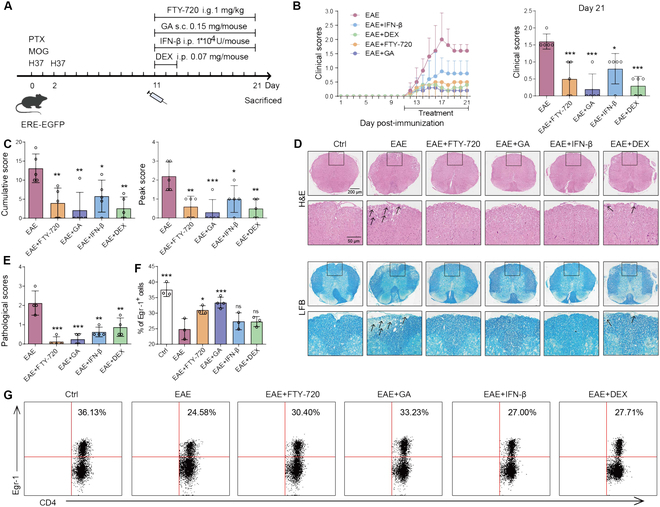
Foxp3+ regulatory T (Treg) cells, as one of the subtypes of CD4+ T cells, are the crucial gatekeeper in the pathogenesis of self-antigen reactive diseases. In this context, we demonstrated that the selective ablation of early growth response gene 1 (Egr-1) in CD4+ T cells exacerbated experimental autoimmune encephalomyelitis (EAE) in murine models. The absence of Egr-1 in CD4+ T cells, obtained from EAE mice and naïve CD4+ T cells, impeded the differentiation and influence of Treg. Importantly, in CD4+ T cells of multiple sclerosis patients, both Egr-1 and Foxp3 were found to decrease. Further studies showed that distinct from the classical Smad3 route, TGF-β could activate Egr-1 through the Raf-Erk signaling route to promote Foxp3 genetic modulation, thereby promoting Treg cell differentiation and reducing EAE inflammation. A novel natural Egr-1 agonist, calycosin, was found to attenuate EAE progression by regulating the differentiation of Treg. Together, the above results indicate the value of Egr-1, as a novel Foxp3 transactivator, for the differentiation of Treg cells in the development of self-antigen reactive diseases.


Conflict of interest statement

Competing interests: The authors declare that they have no competing interests.

Figures

Fig. 1.
Fig. 1.
Expression of Egr-1 in CD4+ T cells was inversely related to the severity of EAE in mice. (A) RNA sequencing screened genes differentially expressed in CD4+ T cells in the spleen of EAE mice with mild disease (neurofunctional score of 0.5) and severe disease (neurofunctional score of 4). (B) Comparison of mRNA manifestation of Egr-1 in CD4+ T cells of EAE mice with mild disease (neurofunctional score of 0.5) and severe disease (neural functional score of 4) by qPCR. n = 4. (C and D) Egr-1 manifestation in EAE mice with different scores and correlation analysis of Egr-1 manifestation in CD4+ T cells with EAE scores. n = 4. SP, spleen; LN, lymph nodes. (E to G) CD4+ T cells in PBMCs of treatment-naïve MS patients and healthy donors. Afterward, the cells were stimulated with anti-CD3 and anti-CD28 in vitro for 24 h, and the manifestation of Egr-1 and Foxp3 was analyzed. n = 5. (H) EAE was induced in CWT and CKO mice by immunizing with MOG33–55 peptide and neurobehavioral defects. n = 11. (I and J) H&E and LFB staining pathological assessment of spinal cords from CWT and CKO EAE mice on day 21 post-immunization. n = 4. Data are expressed as mean ± SD. *P < 0.05; **P < 0.01; ***P < 0.001.
Fig. 2.
Fig. 2.
CD4+Egr-1 knockout regulated the subtypes of CD4+ T cell differentiation in EAE mice. (A) Proportions of Treg/TH17/TH1 cell subsets in spleen, lymph nodes, and CNS from CWT (Egr-1f/f) and CKO (Egr-1f/f CD4-cre+) EAE mice. (B) Percentage of Foxp3-, IL-17-, and IFN-γ-positive cells. n = 4. (C and D) Representative flow cytometric chart and statistical bar graphs of the percentages of Foxp3- and IL-17-positive cells. n = 3. (E) Representative CFSE fluorescence flow cytometric chart of the inhibition of Tconv cells by Treg polarized from naïve CD4+ T cells sorted from CWT and CKO mice and incubated for 3 d under Treg polarization conditions. These cells were co-incubated with CFSE-labeled responder naïve CD4+ T cells. (F) Statistical analysis of the suppression rate of the Treg from CWT and CKO mice on Tconv cells. Suppression % = (1 − CFSE fluorescence reduction percentage of Tconv cells) × 100%. n = 4. Data are expressed as mean ± SD. ns (not significant), P > 0.05; *P < 0.05; ***P < 0.001.
Fig. 3.
Fig. 3.
Adoptive transfer of CD4+ T cells of CKO EAE mice led to the aggravation of EAE in WT mice. (A) Experimental scheme of the adoptive transfer. CKO and CWT mice were immunized with MOG35–55 for 15 d. Then, CD4+ T cells from lymph node cells were incubated with MOG35–55 (20 μg/ml) and IL-12 (0.5 ng/ml) for 3 d. The treated cells (1 × 10⁷ cells/mouse) were then injected into WT C56BL/6 recipient mice through the tail vein. (B) Clinical score. n = 6. (C) H&E and LFB staining and inflammatory infiltration and demyelination scores in the spinal cord. (D) Proportion of CD4+ T cells in spleen, lymph nodes, and CNS of mice. n = 3 to 4. (E) Proportion of CD4+Foxp3+Treg cells in CNS, spleen, and lymph nodes of mice. (F) Proportion of CD4+IL-17+TH17 cells in CNS, spleen, and lymph nodes of mice. (G) Proportion of CD4+IFN-γ+TH1 cells in CNS, spleen, and lymph nodes of mice. Data are expressed as mean ± SD. *P < 0.05; **P < 0.01; ***P < 0.001 by Student’s t test.
Fig. 4.
Fig. 4.
Egr-1 induced the manifestation of Foxp3 by connection to its promoter site. (A) mRNA manifestation of Foxp3 and RORγt in CD4+ T cells sorted from the spleens of CWT and CKO mice, after stimulation with anti-CD3 (5 μg/ml) plus anti-CD28 (2 μg/ml) for 6 h. (B) mRNA manifestation of Foxp3 under Treg polarization condition. (C) Protein manifestation of Egr-1 and Foxp3 in CD4+ T cells of CWT and CKO EAE mice. (D) Protein manifestation of Egr-1 and Foxp3 in Jurkat cells transfected with PCB6-Egr-1 and PCB6 empty plasmids. (E) Egr-1 protein manifestation in naïve CD4+ T cells sorted from normal mice and transfected with PCB6-Egr-1 plasmid and PCB6 control plasmid. (F) Expression of Foxp3 in naïve CD4+ T cells stimulated with TCR under neutral conditions and transfected with either PCB6-Egr-1 plasmid or PCB6 control plasmid in the presence of anti-TGF-β or control IgG. n = 4. (G) Schematic diagram depicting and the putative Egr-1 connection site (−131 bp to −124 bp). (H and I) ChIP analysis performed using a negative control immunoglobulin G (IgG) or anti-Egr-1 antibody in CD4+ T cells of EAE mice. (J) Schematic diagram depicting the sequences in the WT and mutant (MT) Foxp3 stimulator. (K) Luciferase activity analysis in EL4 T cells transfected with Foxp3 Promoter-WT plasmid and Foxp3 Promoter-MT plasmid after overexpressing Egr-1. n = 6. Data are expressed as mean ± SD. ns, P > 0.05; ***P < 0.001.
Fig. 5.
Fig. 5.
TGF-β regulated the manifestation of Egr-1 in CD4+ T cells through the Ras/Raf/Mek/Erk signaling route. (A) Representative flow cytometric chart of Egr-1 manifestation in naïve CD4+ T cells stimulated with TCR in the absence or presence of TGF-β and IL-2 for 24 h. (B) Statistical analysis of the percentage of Egr-1-positive cells. (C and D) Protein manifestation stimulated with TGF-β. (E and F) Protein manifestation after pretreatment with GW5074 (inhibitor of Raf, 10 μM). (G and H) Protein manifestation after pretreatment with U0126 (inhibitor of Erk and Mek, 10 μM). n = 4. (I and J) Expression of Raf/Mek/Erk/Egr-1 protein after adding SIS3 (1 μM) during Treg differentiation. (K and L) Proportion of Treg cell differentiation. Data are expressed as mean ± SD. *P < 0.05; **P < 0.01; ***P < 0.001.
Fig. 6.
Fig. 6.
Egr-1 agonist CAL and FN had curative impact on EAE mice. (A) Screening of Egr-1 agonists by using ERE luciferase reporter gene. n = 5 to 6. (B) Daily neurobehavioral assessment of EAE mice treated with CAL, FN, FTY-720, or vehicle. n = 8. (C and D) Daily neurobehavioral assessment of EAE mice treated with CAL (10, 20, and 40 mg/kg), FTY-720, or vehicle. n = 9. (E) Neurobehavioral assessment. n = 9. (F) Body weight of EAE mice. n = 9. (G) Cumulative score and peak score. n = 9. (H and I) H&E and LFB staining and inflammatory infiltration and demyelination scores in the spinal cord of EAE mice. n = 3. Data are expressed as mean ± SD. *P < 0.05; **P < 0.01; ***P < 0.001.
Fig. 7.
Fig. 7.
Egr-1 agonist CAL affected Treg differentiation and influence through CD4+Egr-1. (A) Schematic diagram of Treg differentiation. (B and C) Different concentrations of CAL were added during CWT/CKO Treg differentiation, and the ratio of Foxp3+Treg cells was detected. n = 3. (D) IL-10 secretion in Treg cell incubation medium. n = 3. (E) Schematic diagram of Treg immunosuppression. (F) Representative CFSE fluorescence flow cytometric chart of the inhibition of Tconv cells by Treg polarized from naïve CD4+ T cells sorted from CWT and CKO mice and incubated with 40 μM CAL for 3 d under Treg polarization conditions. These cells were co-incubated with CFSE-labeled responder naïve CD4+ T cells. (G) Statistical analysis of the suppression rate of the Treg on Tconv cells. n = 3. Data are expressed as mean ± SD. ns, P > 0.05; *P < 0.05; **P < 0.01; ***P < 0.001.
Fig. 8.
Fig. 8.
Clinical drugs for MS such as FTY-720 and GA could activate Egr-1 manifestation. (A) After 11 d of EAE activation in ERE-EGFP mice, FTY-720 (1 mg/kg), GA (0.15 mg/mouse), IFN-β (1 × 10⁴ U/mouse), and DEX (0.07 mg/mouse) were administered. n = 5. (B) Daily neurobehavioral assessment and score statistics. n = 5. (C) Cumulative score and peak score of EAE mice. n = 5. (D and E) H&E and LFB staining and inflammatory infiltration and demyelination scores in the spinal cord. n = 4. (F and G) Proportion of CD4+Egr-1+ cells in lymph nodes of EAE mice. n = 3. Data are expressed as mean ± SD. *P < 0.05; **P < 0.01; ***P < 0.001, versus EAE group.

Similar articles

References

    1. Zhang CY, Ma PX, Qin A, Wang L, Dai KR, Liu YY, Zhao J, Lu ZY. Current immunotherapy strategies for rheumatoid arthritis: The immunoengineering and delivery systems. Research. 2023;6:0220. - PMC - PubMed
    1. Ben-Nun A, Kaushansky N, Kawakami N, Krishnamoorthy G, Berer K, Liblau R, Hohlfeld R, Wekerle H. From classic to spontaneous and humanized models of multiple sclerosis: Impact on understanding pathogenesis and drug development. J Autoimmun. 2014;54:33–50. - PubMed
    1. Oh J, Vidal-Jordana A, Montalban X. Multiple sclerosis: Clinical aspects. Curr Opin Neurol. 2018;31(6):752–759. - PubMed
    1. Constantinescu CS, Farooqi N, O’Brien K, Gran B. Experimental autoimmune encephalomyelitis (EAE) as a model for multiple sclerosis (MS). Brit J Pharmacol. 2011;164(4):1079–1106. - PMC - PubMed
    1. Kohm AP, Carpentier PA, Miller SD. Regulation of experimental autoimmune encephalomyelitis (EAE) by CD4+CD25+ regulatory T cells. Novartis Found Symp. 2003;252:45–52. - PubMed

LinkOut - more resources