[Preprint]. 2025 Apr 23:2025.03.27.645769.
doi: 10.1101/2025.03.27.645769.

Structural Insights into Kainate Receptor Desensitization

Affiliations

Structural Insights into Kainate Receptor Desensitization

Changping Zhou et al. bioRxiv. .

Abstract

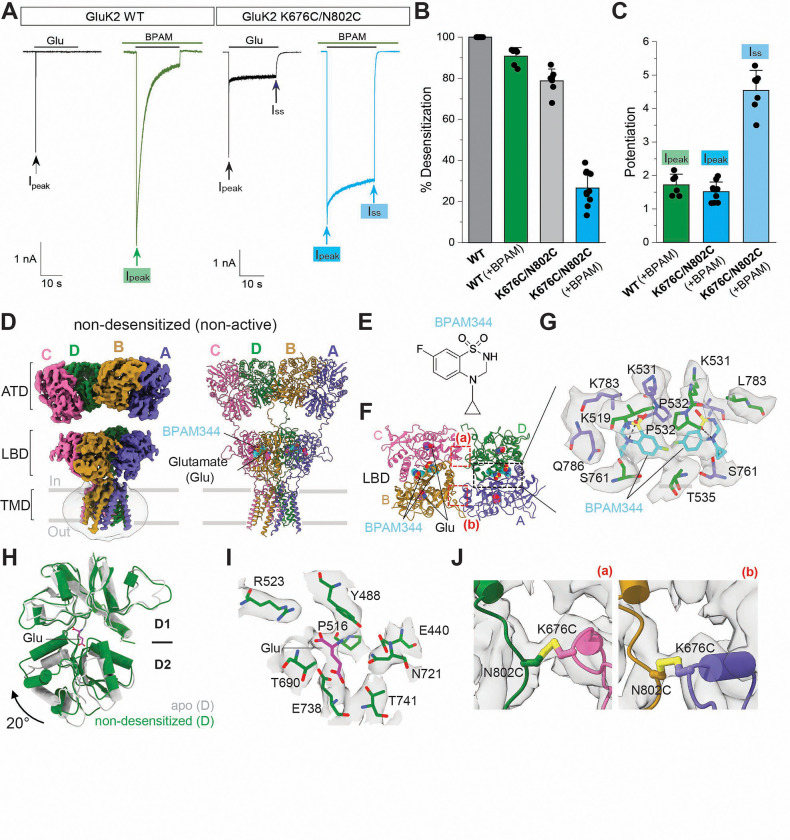
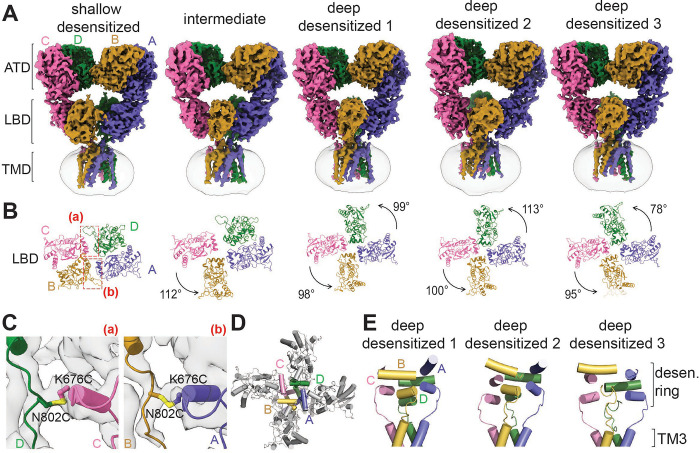
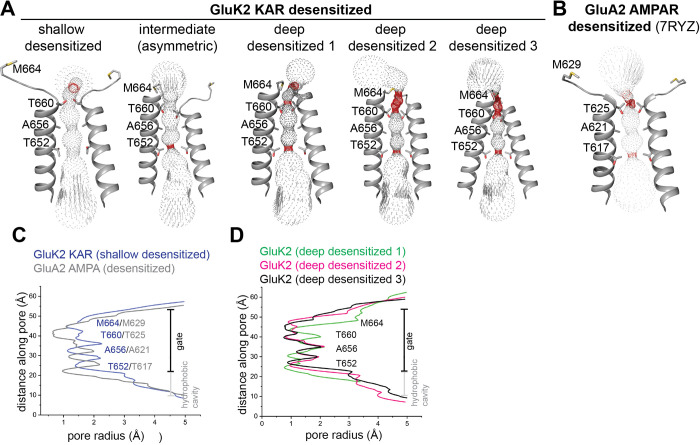
Kainate receptors (KARs), along with AMPA and NMDA receptors, belong to the ionotropic glutamate receptor (iGluR) family and play critical roles in mediating excitatory neurotransmission throughout the central nervous system. KARs also regulate neurotransmitter release and modulate neuronal excitability and plasticity. Receptor desensitization plays a critical role in modulating the strength of synaptic transmission and synaptic plasticity. While KARs share overall structural similarity with AMPA receptors, the desensitized state of KARs differs strikingly from that of other iGluRs. Despite extensive studies on KARs, a fundamental question remains unsolved: why do KARs require large conformational changes upon desensitization, unlike other iGluRs? To address this, we present cryo-electron microscopy structures of GluK2 with double cysteine mutations in non-desensitized, shallow-desensitized and deep-desensitized conformations. In the shallow-desensitized conformation, two cysteine crosslinks stabilize the receptors in a conformation that resembles the desensitized state of AMPA receptors. However, unlike the tightly closed pore observed in the deep-desensitized KAR and desensitized AMPAR conformations, the channel pore in the shallow-desensitized state remains incompletely closed. Patch-clamp recordings and fluctuation analysis suggest that this state remains ion-permeable, indicating that the lateral rotational movement of KAR ligand-binding domains (LBDs) is critical for complete channel closure and stabilization of the receptor in desensitization states. Together with the multiple conformations representing different degree of desensitization, our results define the unique mechanism and conformational dynamics of KAR desensitization.

Keywords: Kainate-type ionotropic glutamate receptors; desensitization mechanism; structure.


Conflict of interest statement

Competing interests The authors declare no competing interests.

Figures

Figure 1.
Figure 1.. Functional and structural characterization of GluK2 K676C/N802C.
(A) Representative whole-cell patch-clamp trace showing response of GluK2 WT or GluK2 K676C/N802C to a 20-second application of 1 mM glutamate in the absence and presence of BPAM344 (BPAM). Arrows indicate the maximum peak current (Ipeak) and the steady-state current (Iss). (B) Quantification of percent desensitization for currents evoked by 1 mM glutamate. (C) Potentiation of the peak current amplitudes (Ipeak) of GluK2 WT (left), the peak current amplitudes (Ipeak) of K676C/N802C (middle), and the steady-state current amplitude (Iss) of GluK2 K676C/N802C measured in the presence of BPAM344 compared to currents in the absence of BPAM344. (D) Cryo-EM map and model of GluK2 K676C/N802C in complex with glutamate and BPAM344 in a non-desensitized/non-active state. (E) Chemical structure of BPAM344. (F) Structure of the LBD layer viewed parallel to the membrane, with BPAM344 and glutamate shown as space-filling models, colored pink and cyan, respectively. (G) Close-up view of the BPAM344 binding site at the AD subunit interface, indicating by a black dotted box in panel F. (H) Comparison of the apo GluK2 LBD (PDB code 9CAZ) and the glutamate-bound GluK2 LBD in the non-desensitized LBD conformation. The LBD is a bi-lobed structure, consisting of D1 and D2 lobes, with glutamate binding in the cleft between them. The D1 lobe is superimposed, and the rotation angles to align the D2 residues were calculated. The glutamate-bound bi-lobe is closed 20° than the apo state LBD conformation. (I) Cryo-EM density for bound glutamate and the surrounding residues in the agonist binding pocket. (J) The cryo-EM densities for disulfide bonds between K676C and N802C in AB and CD subunits. The crosslinks in the LBD layers are indicated by the red dotted box in the panel F.
Figure 2.
Figure 2.. Structural mechanism of GluK2 upon activation and desensitization.
(A) Comparison of Cryo-EM reconstructions and models of BPAM344- and glutamate-bound GluK2 K676C/N802C in a non-desensitized conformation, and BPAM344-, glutamate-, and Concanavalin A-bound GluK2 in an open (active) state (PDB code 9B36). The distances between S700 in the AC subunits and E788 in the BD subunits at the LBD dimer-dimer interface are colored red and blue, respectively. (B) Structural comparison of LBD dimers in the non-desensitized and open GluK2, viewed perpendicular to the membrane. The locations of the centers of mass (COM) of D1 and D2 are indicated by blue and green spheres, respectively, with the COM distances between D1 and D2 of subunit AD LBDs (shown as circles) displayed below. Arrows indicate LBD bi-lobe closure, with the D2 lobe moving closer to D1. Distances between the Cα atoms of P773 (D1-D1 distance) and S670 (D2-D2 distance) in the AD subunits are also indicated. (C) Comparison of LBD-TM3 linkers and TM3 formation in BPAM344-bound, agonist-unbound GluK2 (PDB code 8FWS) and non-desensitized GluK2, showing the subunit BD pair (left) and the subunit AC pair (right). S670 is shown as spheres in corresponding colors for the non-desensitized state and in gray for BPAM344-bound GluK2. The cross-dimer distances between the Cα atoms of S670 (in the BD and AC subunit pairs) are indicated above. Residues forming the ion channel pore are displayed as sticks. The locations of the TM3 gating hinge at A656 (subunit BD) and E662 (subunit AC) in the non-desensitized conformation are highlighted in red. The dotted line indicates the positions of pore-lining residues: (1) M664, (2) T660, (3) A656, and (4) T652. (2’) E662, which serves as the gating hinge, is also highlighted in this panel. Helices surrounding T664 and M664 in subunit BD, as well as helices around M664 in subunit AC, are unwound in the non-desensitized conformation. As a result, the ion channel pore above the gating region in the non-desensitized conformation is wider compared to that in the BPAM344-bound GluK2 structure, with black allows indicating the conformational changes. (D) Comparison of LBD-TM3 linkers and TM3 formation in non-desensitized GluK2 and BPAM344-, ConA- and glutamate bound open GluK2 (PDB code 9B36), showing the subunit BD pair (left) and subunit AC pair (right). The cross-dimer distances between the Cα atoms of S670 are indicated above. Residues forming the ion channel pore are displayed as sticks. The locations of the gating hinge at L655 in A-D subunits of the open GluK2 (PDB 9B36) structure are highlighted in gray, for comparison with the gating hinge in the non-desensitized conformation shown in panel C. The dotted line indicates the positions of pore-lining residues: (1) M664, (2) T660, (3) A656, and (4) T652, as well as (4’) L655, which forms the gating hinge. Yellow, green, blue, and pink arrows indicate the rearrangement of TM3 in each subunit during the transition from the non-desensitized to the open conformation. (E) Pore profile in the non-desensitized and open (PBD 9B36) structures. Pore-delineating dots are colored according to pore radius: red for regions with a radius less than 1.1 Å and gray for regions with a radius greater than 1.1 Å, which would allow passage of a dehydrated ion (1.1 Å for calcium). (F) The pore radius for the non-desensitized (red) and open (PDB 9B36, gray) conformations, calculated using HOLE.
Figure 3.
Figure 3.. Structures of GluK2 in desensitized states.
(A) Three-dimensional (3D) cryo-EM reconstructions of glutamate-bound GluK2 K676C/N802C in desensitized conformations. (B) Top views of glutamate-bound GluK2 K676C/N802C, focusing on the LBD layers. The in-plane rotation angles of the LBDs are indicated. Disulfide bonds formed between the two LBD dimers are highlighted in red dotted boxes. (C) Close-up view of the disulfide bonds between K676C and N802C at the CD subunit interface (left) and the AC subunit interface (right) in the shallow-desensitized conformation. (D) Top view of the LBD layer in the deep-desensitized conformation, highlighting helices E and G, which form the desensitization ring. The view is parallel to the membrane, with coloring consistent with panel A. (E) The desensitization ring formed in three deep-desensitized conformations, viewed perpendicular to the membrane. The in-plane rotation of the LBD shown in panel B shifts the LBD-TM3 linker, positioning it above the ion channel pore formed by the TM3 helices.
Figure 4.
Figure 4.. GluK2 stabilized in a shallow-desensitized-like conformations resembbles the desensitized conformation of AMPARs.
(A, B) Structural comparison between the non-desensitized and shallow-desensitized conformations, viewed parallel (A) and perpendicular (B) to the membrane. Black arrows indicate the degree of LBD domain rotation. (C, D) Structural comparison of LBD layers in GluK2 K676C/N802C in the shallow-desensitized state and GluA2 AMPAR in the desensitized state (PDB code 7RYZ), viewed parallel (C) and perpendicular (D) to the membrane. Distances between S700 in the AC subunits and E788 in the BD subunits at the LBD dimer-dimer interface are shown in red and blue, respectively. The locations of the centers of mass (COM) of D1 and D2 are indicated by blue and green spheres, respectively, with the COM distances between D1 and D2 of subunit AD LBDs (shown as circles) displayed below. Arrows indicate D1 lobe rotations compared to the non-desensitized (KAR) or apo (AMPAR) states. Distances between the Cα atoms of P773 (D1-D1 distance) and S670 (D2-D2 distance) in the AD subunits are also indicated. (E) Comparison of LBD-TM3 linkers and TM3 helices in non-desensitized and shallow-desensitized conformations, showing the subunit BD pair (left) and subunit AC pair (right). S670 is shown as spheres in corresponding colors for the shallow-desensitized conformation and in gray for the non-desensitized conformation. The cross-dimer distances between the Cα atoms of S670 are indicated. Residues forming the ion channel pore are displayed as sticks. The locations of the TM3 gating hinge at T660 (subunit BD) and M664 (subunit AC) in the shallow-desensitized conformation are highlighted in red. The dotted line indicates the positions of pore-lining residues: (1) M664, (2) T660, (3) A656, and (4) T652. The shallow-desensitized conformation contains an additional half-turn of helices at T660 compared to the non-desensitized conformation. (F) Comparison of LBD-TM3 linkers and TM3 formation in shallow- and deep-desensitized GluK2, showing the subunit BD pair (left) and the subunit AC pair (right). S670 is represented as spheres in corresponding colors for the deep-desensitized state and in gray for the shallow-desensitized GluK2. In the deep-desensitized conformation, the ion channel is sealed at M664, completely closing the ion channel pore, in contrast to the shallow-desensitized conformation, which has a kink at T660 in the BD subunits.
Figure 5.
Figure 5.. Ion channel pore of desensitized GluK2 KAR.
(A) Permeation pathway dictating pore diameter of GluK2 K676C/N802C in desensitized states. Pore-delineating dots are colored according to pore radius: red for regions with a radius less than 1.1 Å and gray for regions with a radius greater than 1.1 Å. (B) Permeation pathway determining the pore diameter of the GluA2 AMPAR in a desensitized state (PDB code 7RYZ), using the same color code as (A). (C–D) Pore profile traces comparing GluK2 K676C/N802C KAR. Comparison between the shallow-desensitized conformation and the desensitized GluA2 AMPAR (PDB: 7RYZ) (C); and comparison among three deep-desensitized states (D).
Figure 6.
Figure 6.. Functional characterization of GluK2 K676C/N802C receptor.
(A) Representative whole-cell patch-clamp recordings of GluK2 WT (left) and GluK2 K676C/N802C (right) in response to varying concentrations of glutamate (0.001–50 mM). The black bar at the top of the recording represents the glutamate application. The cells were held at −70 mV. (B) Quantification of current density (pA/pF) at the peak current for GluK2 WT (gray) and K676C/N802C mutant (blue) activated by 10 mM glutamate. No significant differences were observed (NS, p > 0.05). (C) Glutamate dose-response curves for GluK2 WT (n=12) and K676C/N802C (n=8), normalized to the maximal response at 50 mM glutamate. Glutamate was applied for 1 s, and the peak current was measured at each concentration. All response were recorded at each concentrations using a single cell. (D) EC50 values for glutamate activation of GluK2 WT (gray) and K676C/N802C (blue). No significant differences were detected (NS, p > 0.05). (E) Ratio of steady-state to peak current (Isteady-state / Ipeak) at various glutamate concentrations. The values of the steady-state current were taken at the end of the activation. (F) Representative current traces of GluK2 WT (black) and GluK2 K676C/N802C (blue) during a two-pulse protocol, showing the interval between glutamate exposures ranging from 50 ms to 20 s, highlighting altered desensitization kinetics in the mutant. (G) Recovery from desensitization at increasing inter-sweep intervals, fitted with one-term exponential functions for GluK2 WT (R2=0.99) and two-term exponential functions for GluK2 K676C/N802C (R2=0.99). GluK2 K676C/N802C exhibits a faster recovery than GluK2 WT. (H) Time constant (τ) of recovery from desensitization, showing a significant reduction in τ for the K676C/N802C mutant (p < 0.0001, two-sided two-sample t-test). The data for the WT was obtained from the fit in panel G, and for K676C/N802C, a mean τ was calculated using τmean = ((A1 τ1 + A2 τ2) / (A1 + A2)). Biological independent measurements: n=9 for GluK2 WT and n=9 for GluK2 K676C/N802C. Error bars represent Standard Deviation (SD). Statistical significance is indicated as NS (not significant) or with p-values where appropriate.
Figure 7.
Figure 7.. Cysteine crosslinking modulates the kinetics of GluK2 K676C/N802C
(A) Representative whole-cell patch-clamp recordings of GluK2 WT (left) and GluK2 K676C/N802C (right) in the presence of 10 mM glutamate before (black) and after treatment with 5 mM DTT for 7 minutes (red). (B) Quantification of the Iss/Ipeak ratio in GluK2 K676C/N802C before (blue) and after (red) DTT treatment, showing a significant reduction in steady-state current post-treatment (p < 0.0001, two-sided two-sample t-test). (C) Recovery from desensitization at increasing inter-sweep intervals after treatment with 5 mM DTT. The GluK2 WT recovery curve from Figure 6, panel C is shown in black for comparison. The recovery kinetics of GluK2 K676C/N802C post-DTT treatment were fitted with a one-term exponential function (R2 = 0.98), showing a recovery profile similar to WT. (D) Time constant (τ) of recovery from desensitization, showing that DTT treatment restores the recovery kinetics of GluK2 K676C/N802C to a level comparable to WT (NS, p > 0.05). (E) Representative whole-cell responses to 10 mM glutamate (200 ms, −70 mV; black bar) from HEK293T cells expressing GluK2 WT (left, average current in black, 60 individual responses in gray) and GluK2 K676C/N802C (right, average current in blue, 100 individual responses in gray). Inset: Current-variance relationship, with WT data fitting a parabolic function (dotted line), whereas the K676C/N802C mutant does not follow this trend. (F) Whole-cell recordings of GluK2 K676C/N802C in response to 10 mM glutamate in the absence (blue) and presence (green) of 500 μM BPAM344. Right panel: Representative noise traces at the end of glutamate application (~10 s) under both conditions, indicated by blue and green boxes. Background noise (baseline) was taken from the current recording before glutamate application, as indicated by the gray box. (G) Variance-mean current relationship for individual cells in the presence of glutamate alone or with BPAM344, indicating an enhanced channel variance-current relationship upon BPAM344 application. (H) Unitary conductance determined by variance-mean analysis, showing no significant difference between two conditions with and without BPAM344 (NS, p > 0.05). (I) Estimated number of open channels, showing a significant increase upon BPAM344 application (p = 0.0025, two-sided paired t-test). Biologically independent measurements: n = 6. Data for glutamate and BPAM344 conditions were obtained from the same cell. Error bars represent standard deviation (SD). Statistical significance is indicated as NS (not significant) or with p-values where appropriate.
Figure 8.
Figure 8.. Schematic representation of conformational rearrangements during activation and desensitization.
The proposed model illustrates how conformational changes in the LBD layers during desensitization regulate ion channel permeation. Wild-type GluK2 typically transitions into a deeply desensitized state, adopting a stabilized, classically four-fold symmetrical conformation. By contrast, receptors that stabilize in a two-fold symmetrical, desensitized AMPAR-like conformation, maintained by engineered disulfide bonds, remain conductive, although their conductivity is lower than that of receptors in the open state. The position of the gating kink differs among the non-desensitized, open, and shallow-desensitized conformations. Additionally, the ATD layers elevate and rotate in both the non-desensitized (non-active) and open-state GluK2 conformations.

References

    1. Hansen K. B. et al. Structure, Function, and Pharmacology of Glutamate Receptor Ion Channels. Pharmacol Rev 73, 298–487 (2021). 10.1124/pharmrev.120.000131 - DOI - PMC - PubMed
    1. Lerma J. Roles and rules of kainate receptors in synaptic transmission. Nat Rev Neurosci 4, 481–495 (2003). 10.1038/nrn1118 - DOI - PubMed
    1. Chittajallu R. et al. Regulation of glutamate release by presynaptic kainate receptors in the hippocampus. Nature 379, 78–81 (1996). 10.1038/379078a0 - DOI - PubMed
    1. Rodríguez-Moreno A., Herreras O. & Lerma J. Kainate receptors presynaptically downregulate GABAergic inhibition in the rat hippocampus. Neuron 19, 893–901 (1997). 10.1016/s0896-6273(00)80970-8 - DOI - PubMed
    1. Cossart R. et al. Presynaptic kainate receptors that enhance the release of GABA on CA1 hippocampal interneurons. Neuron 29, 497–508 (2001). 10.1016/s0896-6273(01)00221-5 - DOI - PubMed

Publication types

LinkOut - more resources