[Preprint]. 2025 Apr 22:2025.03.31.25324958.
doi: 10.1101/2025.03.31.25324958.

Predicting Nonsense-mediated mRNA Decay from Splicing Events in Sepsis using RNA-Sequencing Data

Affiliations

Predicting Nonsense-mediated mRNA Decay from Splicing Events in Sepsis using RNA-Sequencing Data

Jaewook Shin et al. medRxiv. .

Update in

Abstract

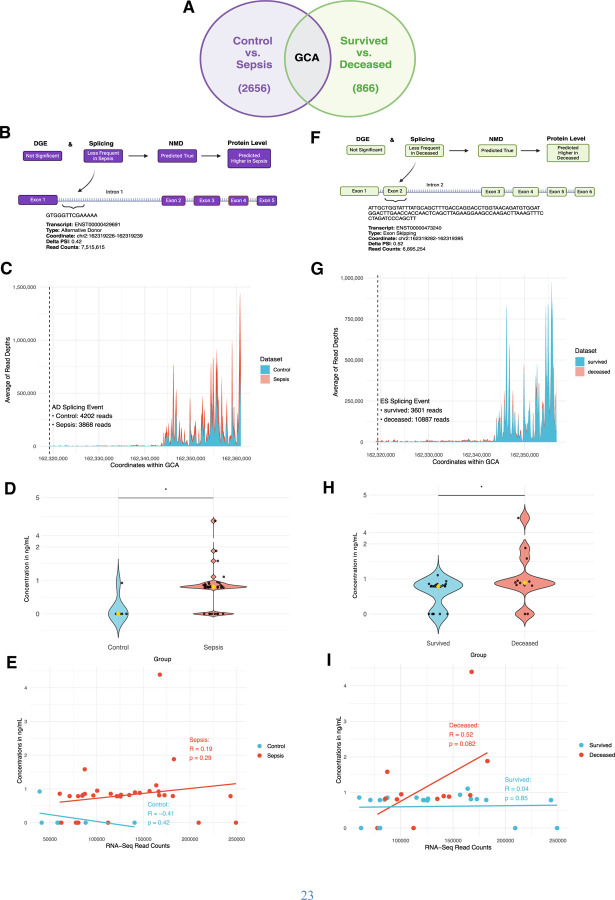
Alternative splicing (AS) and nonsense-mediated mRNA decay (NMD) are highly conserved cellular mechanisms that modulate gene expression. Here we introduce NMD pipeline that computes how splicing events introduce premature termination codons to mRNA transcripts via frameshift, then predicts the rate of PTC-dependent NMD. We utilize whole blood, deep RNA-sequencing data from critically ill patients to study gene expression in sepsis. Statistical significance was determined as adjusted p value < 0.05 and |log2foldchange| > 2 for differential gene expression and probability >= 0.9 and |DeltaPsi| > 0.1 for AS. NMD pipeline was developed based on AS data from Whippet. We demonstrate that the rate of NMD is higher in sepsis and deceased groups compared to control and survived groups, which signify purposeful downregulation of transcripts by AS-NMD or aberrant splicing due to altered physiology. Predominance of non-exon skipping events was associated with disease and mortality states. The NMD pipeline also revealed proteins with potential novel roles in sepsis. Together, these results emphasize the utility of NMD pipeline in studying AS-NMD along with differential gene expression and discovering potential protein targets in sepsis.


Conflict of interest statement

Conflict of Interest statement: The authors have declared that no conflict of interest exists.

Figures

Fig. 1.
Fig. 1.. Differential gene expression (DGE) and alternative splicing (AS) data in control versus sepsis (Fig. 1B-E) and survived versus deceased groups (Fig. 1F-I).
(A) Diagram describing RNA-Seq workflow from ICU patients to their DGE and AS information. Created in https://BioRender.com. (B) Volcano plot showing DGE analysis of significantly up- or down-regulated genes in control vs sepsis based on adjusted p value and Log2 Fold Change (Log2 FC) (red), adjusted p value alone (blue), Log2 FC alone (grey), and not statistically significant (black). (C) Volcano plot showing differential splicing analysis of significantly more or less frequent splicing events in control vs. sepsis based on probability and Delta Percent-Spliced In (Delta PSI) (red), probability alone (blue), Delta PSI alone (grey), and not statistically significant (black). (D) Proportion of each subtype out of all splicing events in control vs. sepsis groups then categorized into “Splicing” and “Transcription-related” groups. (E) Frequency of each of the four splicing events (from “Splicing” group in Fig. 3D) in percentage in control vs sepsis. (F) Volcano plot showing DGE analysis of significantly up- or down-regulated genes in survived vs deceased with same color and statistical depictions as Fig. 1B. (G) Volcano plot showing differential splicing analysis of significantly more or less frequent splicing events in survived vs. deceased with same color and statistical depiction as Fig. 1C. (H) Proportion of each subtype out of all splicing events in survived vs. deceased groups then categorized into “Splicing” and “Transcription-related groups. (I) Frequency of each of the four splicing events (from “Splicing” group in Fig. 3H) in percentage in survived vs deceased.
Fig. 2.
Fig. 2.. Alternative splicing (AS) and nonsense-mediated mRNA decay (NMD) data in control versus sepsis (Fig. 1B-D, H) and survived versus deceased groups (Fig. 1E-G, I).
(A) Diagram describing the development of NMD pipeline from Whippet AS data to NMD outputs. Created in https://BioRender.com. (B) Bar graph showing the percentage of splicing events predicted to induce NMD in control vs sepsis (left) and the percentage of predicted NMD stratified by splicing subtypes (right). (C) Proportion of splicing events of transcripts predicted to cause NMD per each splicing subtype in control vs sepsis. (D) Box plot showing the median number of premature termination codons (PTCs) generated per splicing subtype in control vs sepsis. (E) Bar graph showing the percentage of splicing events predicted to induce NMD in survived vs deceased (left) and the percentage of predicted NMD stratified by splicing subtypes (right). (F) Proportion of splicing events of transcripts predicted to cause NMD per each splicing subtype in survived vs deceased. (G) Box plot showing the median number of premature termination codons (PTCs) generated per splicing subtype in survived vs deceased. (H) Sankey diagram showing all the genes with p < 0.01 in GO Enrichment Analysis and their respective biological processes in control vs sepsis. (I) Sankey diagram showing all the genes with p < 0.01 in GO Enrichment Analysis and their respective biological processes in survived vs deceased.
Fig. 3.
Fig. 3.. NMD pipeline prediction and proteomics data on plasma grancalcin (GCA) in control vs sepsis (Fig. 3B-E) and survived vs deceased groups (Fig. 3F-I).
(A) Diagram describing GCA as the only gene with significant differential splicing in both control vs sepsis (total 2,656 significant differential splicing events) and survived vs deceased (total 866 significant differential splicing events) and with one of the highest absolute RNA-Seq read counts (ARC). Created in https://BioRender.com. (B) Diagram showing prediction on plasma GCA protein level based on DGE, splicing, and NMD data, along with the details on its significant differential splicing event in control vs sepsis. Created in https://BioRender.com. (C) Density map showing the average number of RNA-Seq reads per each 150 bp coordinate range of GCA genome. Dashed line represents the location of the alternative donor (AD) event (from Fig. 3B) and respective number of reads in control vs sepsis at the coordinates of AD event. (D) Violin plot showing the distribution and median ELISA protein concentrations of GCA in each sample in control vs sepsis. (E) Graph showing the correlation data between ELISA concentrations in ng/mL and RNA-Seq read counts of GCA in control vs sepsis. (F) Diagram showing prediction on plasma GCA protein level based on DGE, splicing, and NMD data, along with the details on its significant differential splicing event in survived vs deceased. Created in https://BioRender.com. (G) Density map showing the average number of RNA-Seq reads per each 150 bp coordinate range of GCA genome. Dashed line represents the location of the exon skipping (ES) event (from Fig. 3F) and respective number of reads in survived vs deceased at the coordinates of ES event. (H) Violin plot showing the distribution and median ELISA protein concentrations of GCA in each sample in survived vs deceased. (I) Graph showing the correlation data between ELISA concentrations in ng/mL and RNA-Seq read counts of GCA in survived vs deceased.

References

    1. Lewis BP, Green RE, and Brenner SE. Evidence for the widespread coupling of alternative splicing and nonsense-mediated mRNA decay in humans. Proc Natl Acad Sci U S A. 2003;100(1):189–92. - PMC - PubMed
    1. Fair B, Buen Abad Najar CF, Zhao J, Lozano S, Reilly A, Mossian G, et al. Global impact of unproductive splicing on human gene expression. Nature Genetics. 2024;56(9):1851–61. - PMC - PubMed
    1. Pan Q, Shai O, Lee LJ, Frey BJ, and Blencowe BJ. Deep surveying of alternative splicing complexity in the human transcriptome by high-throughput sequencing. Nat Genet. 2008;40(12):1413–5. - PubMed
    1. Lykke-Andersen S, and Jensen TH. Nonsense-mediated mRNA decay: an intricate machinery that shapes transcriptomes. Nat Rev Mol Cell Biol. 2015;16(11):665–77. - PubMed
    1. Lareau LF, Brooks AN, Soergel DA, Meng Q, and Brenner SE. The coupling of alternative splicing and nonsense-mediated mRNA decay. Adv Exp Med Biol. 2007;623:190–211. - PubMed

Publication types