. 2025 Apr 1:16:1494994.
doi: 10.3389/fmicb.2025.1494994. eCollection 2025.

Nutraceutical supplement slim reshaped colon histomorphology and reduces Mucispirillum schaedleri in obese mice

Affiliations

Nutraceutical supplement slim reshaped colon histomorphology and reduces Mucispirillum schaedleri in obese mice

Jessica Alves Freitas et al. Front Microbiol. .

Abstract

Introduction: Bioactive compounds and whole foods have emerged as promising interventions to address gut microbiota dysbiosis linked to obesity. Compounds such as berberine and coenzyme Q10 are well-recognized for their roles in managing metabolic syndrome and exerting antioxidant effects, while beet pulp, rich in fiber and antioxidants, enhances gut health through additional prebiotic benefits.

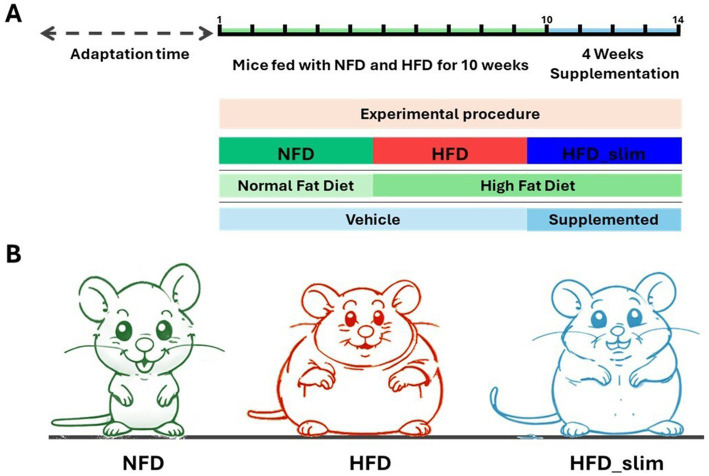
Methods: This study evaluated the effects of a nutraceutical supplement, Slim, on the modulation of gut microbiota in obese mice induced by a high-fat diet.

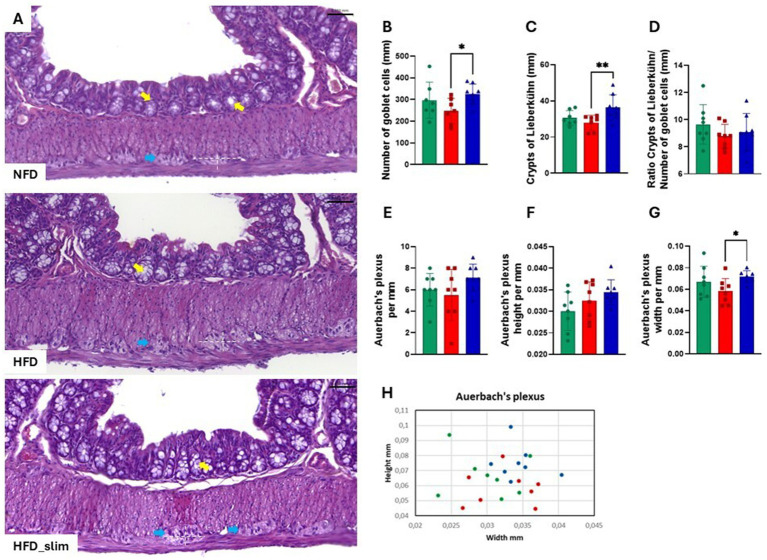
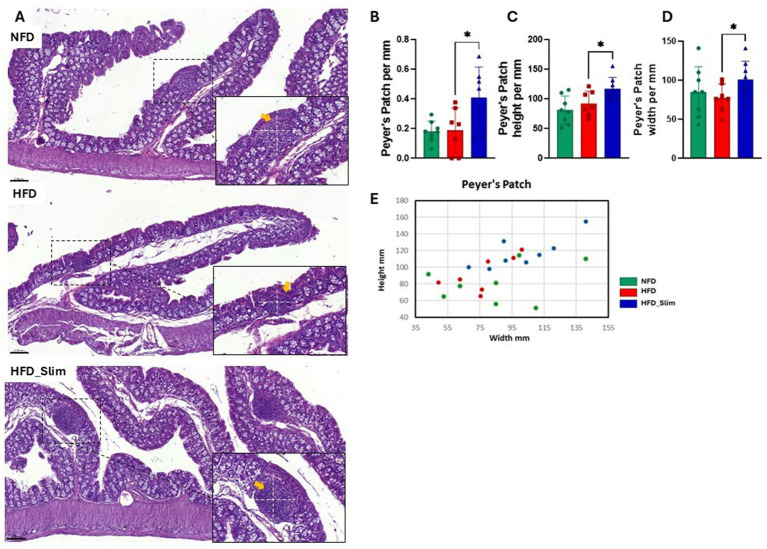
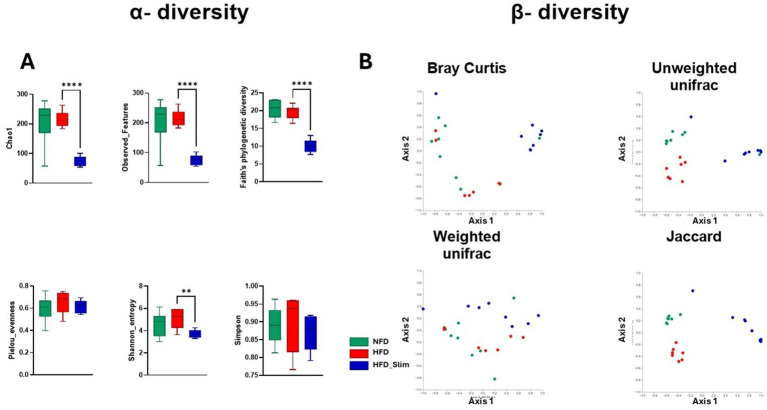
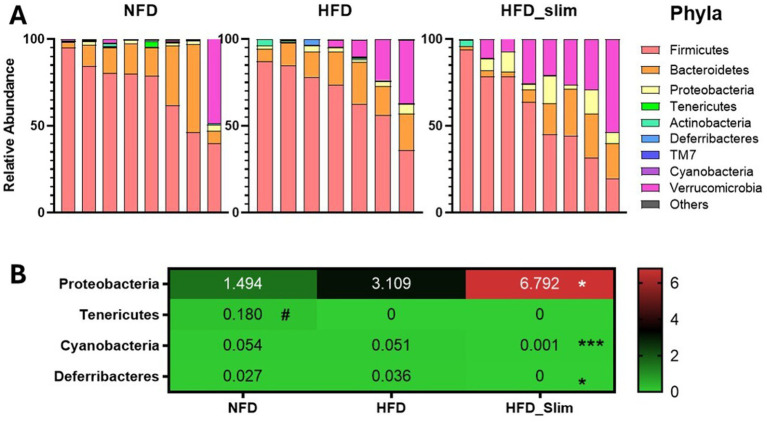
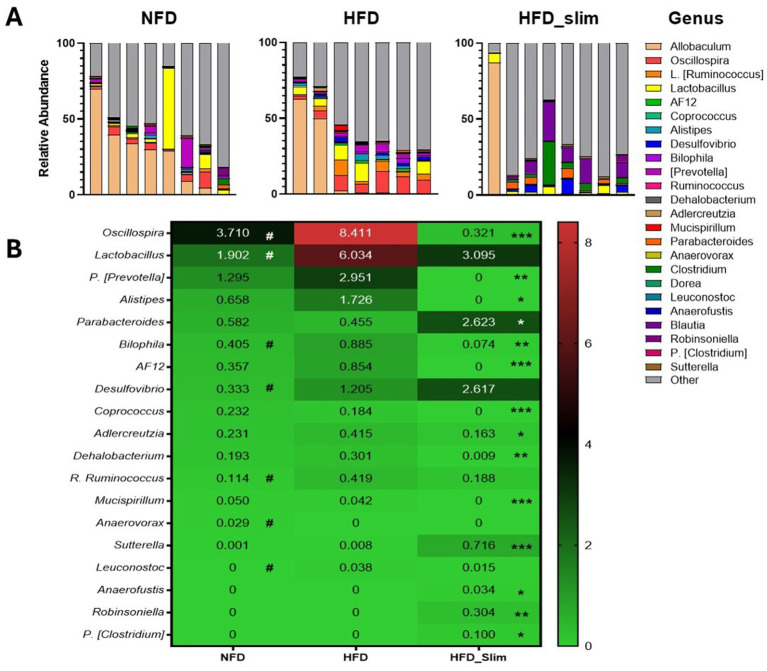
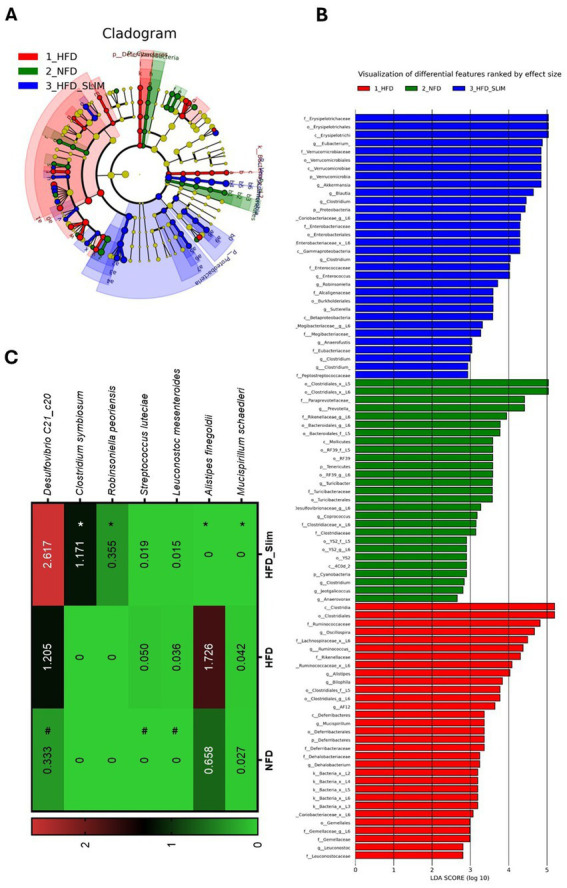
Results: Our results demonstrated that Slim supplementation significantly improved lipid metabolism, reshaped colon histomorphology, and decreased levels of Mucispirillum schaedleri, which were correlated with VLDL-c and triglycerides.

Discussion: We suggest these effects are driven by a duplibiotic effect, resulting from the synergistic action of the bioactive compounds.

Keywords: beet pulp; berberine; coenzyme q10; gut microbiota; nutraceutical; obesity; prebiotic.


Conflict of interest statement

VN and JO are part of the Company Efeom Nutrition S.A as partners who may benefit in some way from revenues or financial losses with the publication of this manuscript, now or in the future. JAF, AS, ES, and AP received salaries from Efeom Nutrition S.A. VN, JO, and AP hold patents related to the content of the manuscript. The remaining authors declare that the research was conducted in the absence of any commercial or financial relationships that could be construed as a potential conflict of interest.

Figures

Figure 1
Figure 1
Schematic sketch of the experimental procedure and supplementation time. (A) Experimental schedule. (B) Experimental groups: NFD, Non-Fat Diet; HFD, High Fat Diet; HFD_Slim, High Fat Diet Slim.
Figure 2
Figure 2
Assessment of histomorphological changes in the colon of control and high-fat diet groups after 4 weeks of supplementation. The H&E in stain shows (A) representative histological images of the colon. The graphics show (B) number of Goblet cells; (C) crypts of Lieberkühn; (D) ratio between the number of Goblet cells and crypts of Lieberkühn; (E) Auerbach plexus; (F) Auerbach plexus height (G) Auerbach plexus width (H) Scatter plot representing the Auerbach plexus. Scale bar = 0.050 mm, 200X magnifications. Statistical analyses were performed using the student’s t-test or Kruskal-Wallis test. Data are represented as mean ± SD. n = 7–8 animals per group. Differences were calculated about the HFD group. *p < 0.05; **p < 0.01. NFD, Non-Fat Diet; HFD, High Fat Diet; HFD_Slim, High Fat Diet Slim; mm, millimeters. Goblet cells, yellow arrows; Auerbach plexus, blue arrows; Dashed white, Auerbach plexus area.
Figure 3
Figure 3
Peyer’s patches histomorphometry in the colon of Control and High-Fat Diet groups after 4 weeks of supplementation. The H&E in stain shows (A) representative histological images of the colon. The graphics show (B) Peyer’s patches; (C) Peyer’s patches height; (D) Peyer’s patches width; (E) Scatter plot representing Peyer’s patches. Scale bar = 0.050 mm, 200X and 400X magnifications. Statistical analyses were performed using the student’s t-test or Kruskal-Wallis test. Data are represented as mean ± SD. n = 7–8 animals per group. Differences were calculated about the HFD group. *p < 0.05; NFD, Non-Fat Diet; HFD, High Fat Diet; HFD_Slim, High Fat Diet Slim; Dashed white, Peyer’s patches area.
Figure 4
Figure 4
Person correlation analysis between α-diversity, phyla, genera, species, colon histomorphology, VLDL cholesterol and triglycerides of Control and High-Fat Diet groups after 4 weeks of supplementation. (A) Heatmap (correlation matrix) Pearson correlation coefficient (R) between the relative abundance (%) of bacteria α-diversity, phyla, genera, species, colon histomorphology, VLDL cholesterol and triglycerides of supplemented mice after 4 weeks. (B) Sankey diagram showing the relationship between phylum, genus, and species of bacteria from the intestinal mucosa of NFD, HFD, and HFD_Slim mice. *p < 0.05; **p < 0.01; ***p < 0.001. NFD, Non-Fat Diet; HFD, High Fat Diet; HFD_Sim, High Fat Diet Slim.
Figure 5
Figure 5
Alpha diversity (α) and beta diversity (β) in the gut microbiota in the Control and High-Fat Diet groups after 4 weeks of supplementation. (A) Alpha diversity (α) index. Chao1, Observed_Featured, Faith_pd, Pielou_evenness, Shannon_entropy and Simpson. (B) Beta diversity (β) index. Bray-Curtis, Jaccard, Unweighted_unifrac, Weighted_unifrac. Statistical analyses were represented by Student’s t-test or Kruskal-Wallis. Data are represented as mean ± SD. n = 7–8 animals per group. Differences were calculated relative to the HFD group. **p < 0.01 and ****p < 0.0001. NFD, Non-Fat Diet; HFD, High Fat Diet; HFD_Slim, High Fat Diet Slim.
Figure 6
Figure 6
Composition of relative abundance of gut microbiota phyla in the Control and High-Fat Diet groups after 4 weeks of supplementation. (A) Relative abundance of phyla. (B) Heat map of relative abundance of phyla with statistical differences. Data were represented as mean ± SD. n = 7–8 animals per group. (#) Means the difference between NFD and HFD. (*) Means the difference between HFD and HFD_Slim. #p < 0.01; *p < 0.0,5, **p < 0.01, and ***p < 0.001. NFD, Non-Fat Diet; HFD, High Fat Diet; HFD_Slim, High Fat Diet Slim.
Figure 7
Figure 7
Composition of gut microbiota genera in the Control and High-Fat Diet groups after 4 weeks of supplementation. (A) Relative abundance of genera. (B) Heat map of relative abundance of genera with statistical differences. Data were represented as mean ± SD. n = 7–8 animals per group. (#) Means the difference between NFD and HFD. (*) Means the difference between HFD and HFD_Slim. #p < 0.01; *p < 0.0,5, **p < 0.01, and ***p < 0.001. NFD, Non-Fat Diet; HFD, High Fat Diet; HFD_Slim, High Fat Diet Slim; NFD, Non-Fat Diet; HFD, High Fat Diet; HFD_Slim, High Fat Diet Slim.
Figure 8
Figure 8
Differentially enriched bacterial taxons by LEfSe in gut microbiota of the Control and High-Fat Diet groups after 4 weeks of supplementation. (A) Cladogram of significant changes across taxonomic levels. The root of the cladogram represents the bacteria domain. Node size represents taxon abundance. The most abundant enriched taxon among the NFD (blue), HFD (green), and HFD_Slim (red) groups. (B) Graphical representation of the most abundant bacterial feature. Only taxon meeting an LDA significance threshold >2 is shown. (C) Heat map of the relative abundance of species with statistical differences. Data were represented as mean ± SD. n = 7–8 animals per group. Differences were calculated relative to the HFD group. #p < 0.01 – significant difference between NFD and HFD; *p < 0.05, **p < 0.01, and ***p < 0.001 – significant difference between HFD_Slim and HFD. NFD, Non-Fat Diet; HFD, High Fat Diet; HFD_Slim, High Fat Diet Slim.

Similar articles

References

    1. Abenavoli L., Scarpellini E., Colica C., Boccuto L., Salehi B., Sharifi-Rad J., et al. . (2019). Gut microbiota and obesity: a role for probiotics. Nutrients 11:2690. doi: 10.3390/nu11112690, PMID: - DOI - PMC - PubMed
    1. Adekolurejo O. O., McDermott K., Greathead H. M. R., Miller H. M., Mackie A. R., Boesch C. (2023). Effect of red-beetroot-supplemented diet on gut microbiota composition and metabolite profile of weaned pigs—a pilot study. Animals 13:2196. doi: 10.3390/ani13132196, PMID: - DOI - PMC - PubMed
    1. Andrade E., Lima A., Nunes I., Orlando D., Gondim P., Zangeronimo M., et al. . (2016). Exercise and Beta-glucan consumption (Saccharomyces cerevisiae) improve the metabolic profile and reduce the Atherogenic index in type 2 diabetic rats (HFD/STZ). Nutrients 8:792. doi: 10.3390/nu8120792, PMID: - DOI - PMC - PubMed
    1. ANVISA (2018). INSTRUÇÃO NORMATIVA - IN No 28, DE 26 DE JULHO DE 2018. Ministério da Saúde - MS, 1–48. Available online at: https://antigo.anvisa.gov.br/documents/10181/3898888/IN_28_2018_COMP.pdf...
    1. Baud A., Hillion K.-H., Plainvert C., Tessier V., Tazi A., Mandelbrot L., et al. . (2023). Microbial diversity in the vaginal microbiota and its link to pregnancy outcomes. Sci. Rep. 13:9061. doi: 10.1038/s41598-023-36126-z, PMID: - DOI - PMC - PubMed

LinkOut - more resources