. 2025 Apr 1:16:1541683.
doi: 10.3389/fmicb.2025.1541683. eCollection 2025.

Exploring the gut microbiome and serum metabolome interplay in non-functioning pituitary neuroendocrine tumors

Affiliations

Exploring the gut microbiome and serum metabolome interplay in non-functioning pituitary neuroendocrine tumors

Jifang Liu et al. Front Microbiol. .

Abstract

The gut microbiome has emerged as a potential factor in cancer pathogenesis, but its role in non-functioning pituitary neuroendocrine tumors (NF-PitNETs) remains unclear. This study aimed to elucidate gut microbiome and metabolomic alterations in NF-PitNETs by comparing microbial diversity, pathogenic bacteria, and serum metabolomic profiles between NF-PitNET patients and healthy controls. The gut microbiome was assessed through 16S rRNA sequencing, while serum metabolomics was analyzed using mass spectrometry. Correlation analyses identified potential links between microbial characteristics and metabolic markers. The results revealed that specific pathogenic bacteria, such as Bacteroides, were significantly enriched in NF-PitNET patients. Multi-omics correlations suggested that altered microbiota might contribute to NF-PitNET pathogenesis by modulating host metabolic pathways. These findings highlight the potential role of gut microbiome dysbiosis and its metabolic effects in NF-PitNET development, offering insights into possible therapeutic and diagnostic targets.

Keywords: NF-PitNETs; gut microbiota; microbiome-metabolome interactions; serum metabolomics; tumor aggressiveness.


Conflict of interest statement

The authors declare that the research was conducted in the absence of any commercial or financial relationships that could be construed as a potential conflict of interest.

Figures
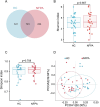
Figure 1
Figure 1
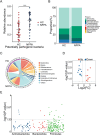
Diversity analysis of the gut microbiota. (A) A Venn diagram showing the unique and common OTUs in each group. (B) The Shannon index and (C) the Simpson index were used to estimate alpha diversity differences between the two groups. (D) Beta diversity analysis comparing the two groups.
Figure 2
Figure 2
Compositional differences in the gut microbiota between NF-PitNETs and HC groups. (A) Relative abundance of potentially pathogenic bacteria predicted using the BugBase database. ***p < 0.001, Mann–Whitney U test. (B) Dominant phyla in each group. (C) Dominant genera and their relative contributions to each group. (D) Volcano plot showing signature bacteria distinguishing the HC and NF-PitNETs groups. (E) Distribution of differential genera at the phylum level.
Figure 3
Figure 3
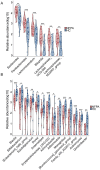
Upregulated and downregulated genera in the NF-PitNETs group. (A) Six upregulated genera and (B) 14 downregulated genera in the NF-PitNETs group. *p < 0.05, **p < 0.01, ***p < 0.001.
Figure 4
Figure 4
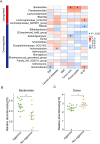
Flora-clinical correlation analysis. (A) The upregulated and downregulated bacterial genera in the NF-PitNETs group were associated with the severity of clinical symptoms in patients. *p < 0.05. (B) Difference in the abundance of Bacteroides between aggressive and non- aggressive NF-PitNETs. **p < 0.01. (C) Difference in the abundance of Dorea between aggressive and non- aggressive NF-PitNETs. *p < 0.05.
Figure 5
Figure 5
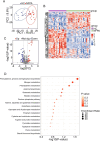
Changes in the plasma metabolite profile in NF-PitNETs patients. (A) PCA revealed significant differences in serum metabolic profiles between the NF-PitNETs and HC groups. (B) Heatmap of differential metabolites in NF-PitNETs and HC groups. (C) Volcano plot of differentially expressed serum metabolites. (D) KEGG pathway enrichment analysis of differential metabolites.
Figure 6
Figure 6
Correlation between differential metabolites and the severity of clinical symptoms. (A) Correlation between upregulated metabolites and the severity of clinical symptoms in NF-PitNETs. *p < 0.05. (B) Correlation between downregulated metabolites and the severity of clinical symptoms in NF-PitNETs. *p < 0.05. (C) Difference in the abundance of upregulated metabolites between aggressive and non-aggressive NF-PitNETs. *p < 0.05. (D) Difference in the abundance of downregulated metabolites between aggressive and non-aggressive NF-PitNETs. *p < 0.05, **p < 0.01.
Figure 7
Figure 7
Sankey plot illustrating the interrelationship between gut flora, serum metabolic features, and major phenotypes. Dark lines represent positive correlations, while light lines represent negative correlations. In the first two columns of the plot, dark blue labels indicate NF-PitNETs-associated genera or metabolites, while light blue labels represent genera or metabolites negatively associated with NF-PitNETs.

Similar articles

References

    1. Aho V. T. E., Houser M. C., Pereira P. A. B., Chang J., Rudi K., Paulin L., et al. . (2021). Relationships of gut microbiota, short-chain fatty acids, inflammation, and the gut barrier in Parkinson's disease. Mol. Neurodegener. 16:6. doi: 10.1186/s13024-021-00427-6, PMID: - DOI - PMC - PubMed
    1. Cheng Y., Ling Z., Li L. (2020). The intestinal microbiota and colorectal Cancer. Front. Immunol. 11:615056. doi: 10.3389/fimmu.2020.615056, PMID: - DOI - PMC - PubMed
    1. Daly A. F., Beckers A. (2020). The epidemiology of pituitary adenomas. Endocrinol. Metab. Clin. N. Am. 49, 347–355. doi: 10.1016/j.ecl.2020.04.002, PMID: - DOI - PubMed
    1. Di Ieva A., Rotondo F., Syro L. V., Cusimano M. D., Kovacs K. (2014). Aggressive pituitary adenomas—diagnosis and emerging treatments. Nat. Rev. Endocrinol. 10, 423–435. doi: 10.1038/nrendo.2014.64, PMID: - DOI - PubMed
    1. Hacioglu A., Gundogdu A., Nalbantoglu U., Karaca Z., Urhan M. E., Sahin S., et al. . (2021). Gut microbiota in patients with newly diagnosed acromegaly: a pilot cross-sectional study. Pituitary 24, 600–610. doi: 10.1007/s11102-021-01137-4, PMID: - DOI - PubMed

LinkOut - more resources