. 2025 Mar 21;33(2):101455.
doi: 10.1016/j.omtm.2025.101455. eCollection 2025 Jun 12.

Virally mediated enhancement of efferent inhibition reduces acoustic trauma in wild-type murine cochleas

Affiliations

Virally mediated enhancement of efferent inhibition reduces acoustic trauma in wild-type murine cochleas

Eleftheria Slika et al. Mol Ther Methods Clin Dev. .

Abstract

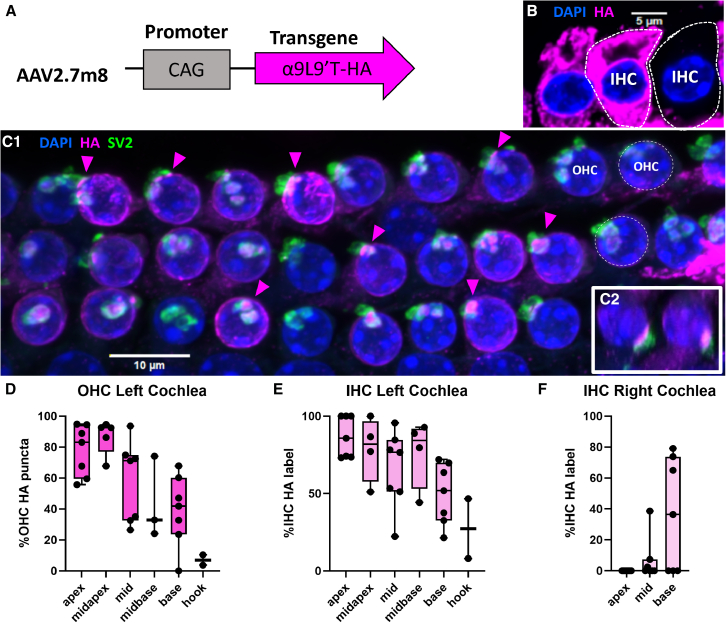
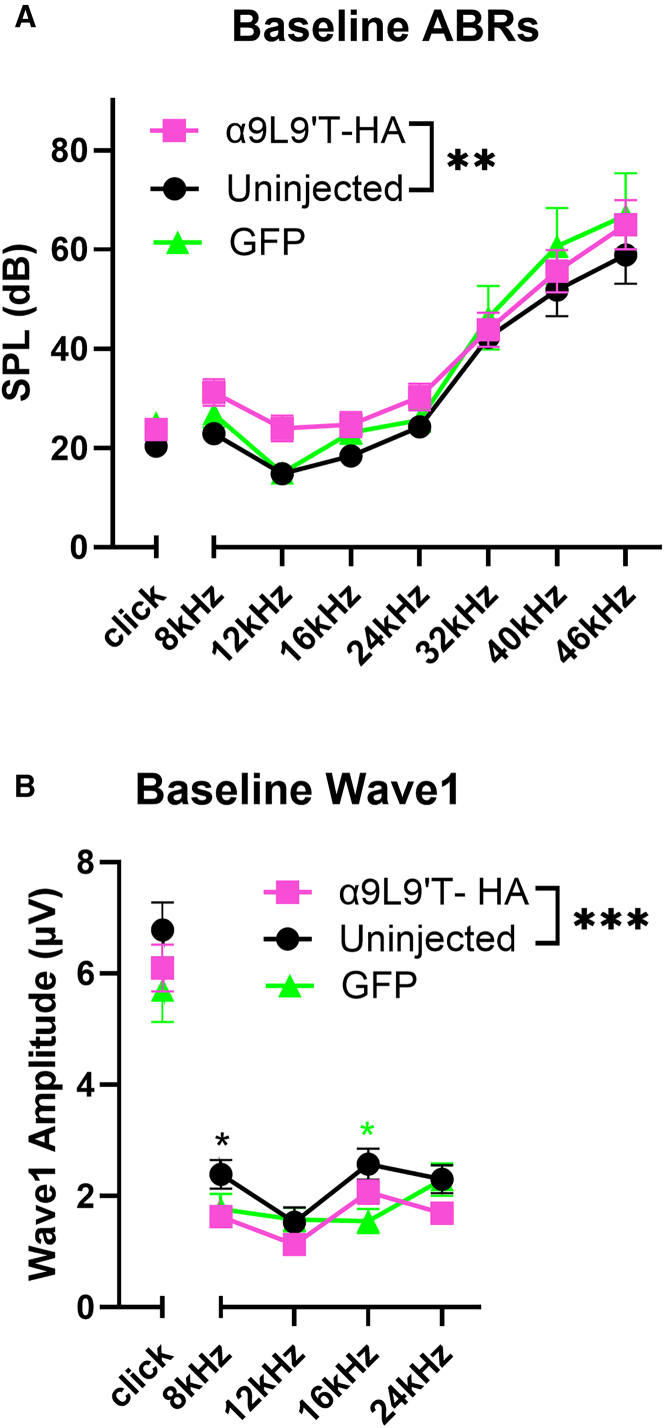
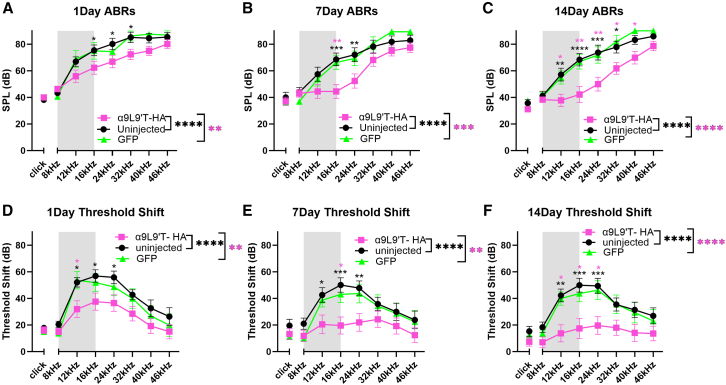
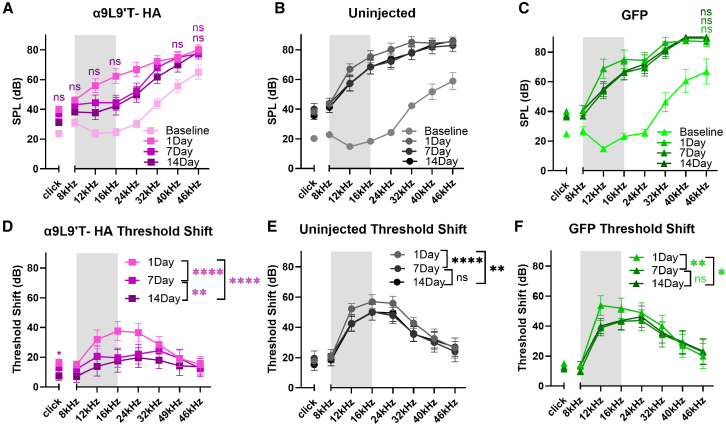
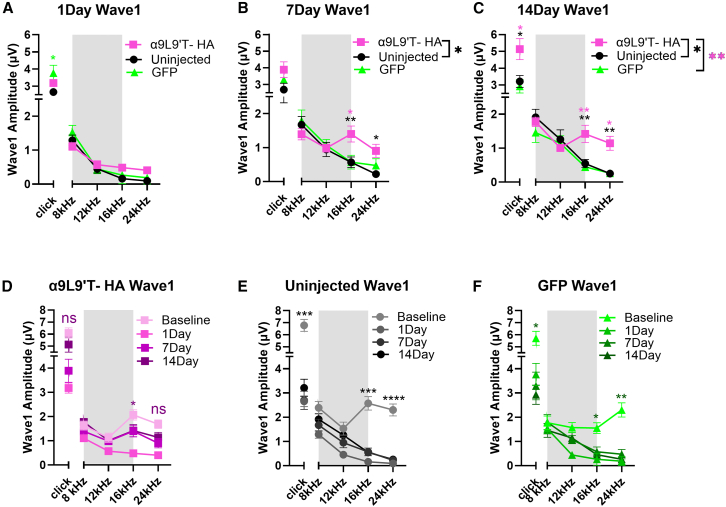
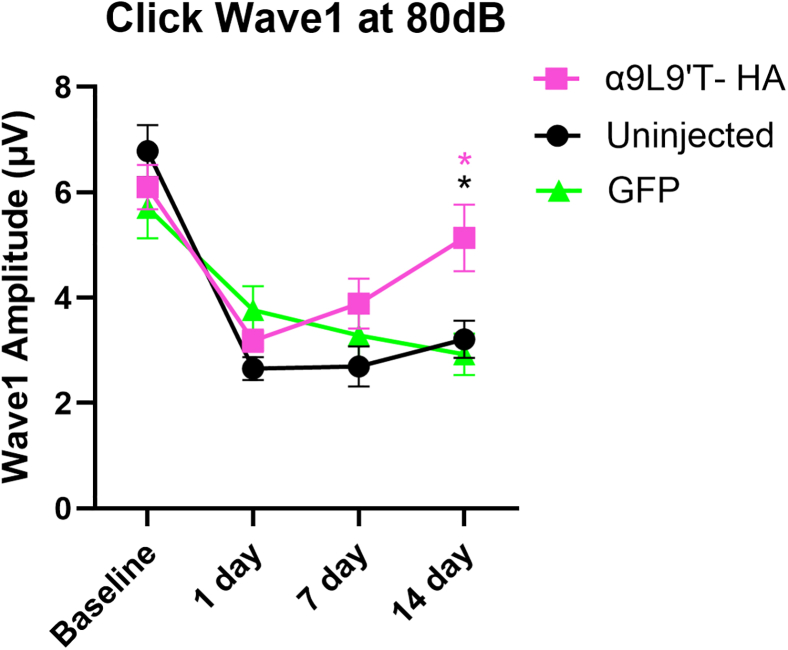
Noise-induced hearing loss (NIHL) poses an emerging global health problem with only ear protection or sound avoidance as preventive strategies. The cochlea receives some protection from medial olivocochlear efferent neurons, providing a potential target for therapeutic enhancement. Cholinergic efferents release acetylcholine (ACh) to hyperpolarize and shunt the outer hair cells (OHCs), reducing sound-evoked activation. The (α9)2(α10)3 nicotinic ACh receptor (nAChR) on the OHCs mediates this effect. Transgenic knockin mice with a gain-of-function nAChR (α9L9'T) suffer less NIHL. α9 knockout mice are more vulnerable to NIHL but can be rescued by viral transduction of the α9L9'T subunit. In this study, an HA-tagged gain-of-function α9 isoform was expressed in wild-type mice to reduce NIHL. Synaptic integration of the virally expressed nAChR subunit was confirmed by HA immunopuncta localized to the postsynaptic membrane of OHCs. After noise exposure, AAV2.7m8-CAG-α9L9'T-HA (α9L9'T-HA)-injected mice had less hearing loss (auditory brainstem response [ABR] thresholds and threshold shifts) than did control mice. ABRs of α9L9'T-HA-injected mice also had larger wave-1 amplitudes and better recovery of wave-1 amplitudes post noise exposure. Thus, virally expressed α9L9'T combines effectively with native α9 and α10 subunits to mitigate NIHL in wild-type cochleas.

Keywords: adeno-associated virus; cholinergic inhibition; cochlear efferents; gene therapy; nicotinic receptor; noise-induced hearing loss; olivocochlear system; outer hair cell; posterior semicircular canal injection.


Conflict of interest statement

US and International Patent Application US2023/033849, filed 9/27/2023, “Cholinergic Gene Therapy to Preserve Hearing” (P.A.F.).

Figures

None
Graphical abstract
Figure 1
Figure 1
Viral transduction of cochlear α9L9′T-HA expression (A) Schematic of AAV2.7m8 bearing the α9L9′T-HA sequence under a strong universal promoter. (B) Representative image of the IHC row of the left basal turn of a 7-week-old C57Bl/J6 wild-type male mouse injected at P3 with 600 nL of AAV2.7m8-CAG-α9L9′T-HA viral solution. IHCs with HA cytoplasmic label in magenta and nuclei stained in blue with DAPI. IHC margins are outlined with white dashed lines. (C1) Maximal intensity projection image of the three OHC rows (1 nucleus in each row indicated by white dashed lines) of the left middle turn of a 7.5-week-old C57Bl/J6 wild-type female mouse injected at P3 with 900 nL of AAV2.7m8-CAG-α9L9′T-HA viral solution. Immunofluorescent secondary antibodies label dense HA puncta (magenta, some indicated by arrowheads) on the OHC postsynaptic membrane juxtaposed to SV2-positive (green) presynaptic terminals, showing synaptic localization of the virally encoded α9 subunit. OHC and supporting cell nuclei are labeled with DAPI (blue). (C2) Resliced image on the z axis of two OHCs of the same region with (C1), where the HA label appears on the postsynaptic density at the basal pole of the OHC, juxtaposed to the SV2-labeled presynaptic terminal. (D–F) HA expression gradient along the cochlear spiral of seven mice (five males and two females). (D) Percent (mean ± maximum, minimum, and individual values) of OHCs with postsynaptic HA expression in seven left (injected) cochleas: apex 7 segments, 847 OHCs; mid apex 5 segments, 717 OHCs; mid 7 segments, 903 OHCs; mid base 3 segments, 459 OHCs; base 7 segments, 794 OHCs; hook 2 segments, 197 OHCs. (E) Left (injected) cochlea (N = 7) percentage (mean ± maximum, minimum, and individual values) of IHC with HA cytoplasmic label: apex 7 segments, 199 IHCs; mid apex 4 segments, 157 IHCs; mid 7 segments, 257 IHCs; mid base 4 segments, 179 IHCs; base 7 segments, 271 IHCs; hook 2 segments, 70 IHCs. (F) Percentage of IHC (mean ± maximum, minimum, and individual values) with HA cytoplasmic label in seven right (contralateral to injected) cochleas, 675 IHCs.
Figure 2
Figure 2
Baseline ABR thresholds and click wave-1 amplitude ABR recordings pre-exposure for all groups (mean ± SEM). C57Bl/J6 wild-type mice, 5 weeks old. α9L9′T-HA injected group, N = 19 (magenta) vs. the uninjected group, N = 14 (black) vs. GFP-injected group, N = 8 (green). Black asterisks for uninjected vs. α9L9′T-HA, magenta asterisks for GFP vs. α9L9′T-HA, green asterisks for GFP vs. uninjected. (A) ABR thresholds at baseline. Kruskal-Wallis test for click thresholds and two-way ANOVA for pure tones with multiplicity adjusted p values after Tukey’s multiple comparisons test. (B) 80-dB wave-1 amplitudes at baseline. Ordinary one-way ANOVA for clicks and two-way ANOVA for pure tones with multiplicity adjusted p values after Tukey’s multiple comparisons test. ∗p < 0.05, ∗∗p < 0.01, ∗∗∗p < 0.001, ∗∗∗∗p < 0.0001; ns not significant.
Figure 3
Figure 3
Post-exposure ABR absolute thresholds and threshold shifts from baseline (A–C) ABR absolute thresholds and (D–F) threshold shifts from baseline. All animals were exposed to an octave-band (8–16 kHz) stimulus at 100 dB for 1 h, represented by the gray area on the frequency band. α9L9′T-HA-injected group N = 19 (magenta), uninjected group N = 14 (black), GFP-injected group N = 8 (green). Black asterisks for uninjected vs. α9L9′T-HA, magenta asterisks for GFP vs. α9L9′T-HA, green asterisks for GFP vs. uninjected. Values are mean ± SEM. ∗p < 0.05, ∗∗p < 0.01, ∗∗∗p < 0.001, ∗∗∗∗p < 0.0001; ns, not significant. Ordinary one-way ANOVA (if normality present) or Kruskal-Wallis test (if non-normal data) for clicks, no significance at any time point. Two-way ANOVA for pure tones with multiplicity adjusted p values with Tukey’s multiple comparisons test for overall group means and individual frequency comparisons.
Figure 4
Figure 4
Threshold absolute values and shifts from baseline at 1, 7, and 14 days post exposure per group Threshold (A–C) absolute values and (D–F) shifts from baseline. All animals were exposed to an octave-band (8–16 kHz) stimulus at 100 dB for 1 h, represented by the gray area on the frequency band. α9L9′T-HA injected group N = 19 (magenta), uninjected group N = 14 (black), GFP-injected group N = 8 (green). Different color intensities represent different time points, and same-color asterisks compare post-exposure time points to baseline of that group. Non-significant (ns) points are depicted as indicators of protection or recovery from acoustic damage. Values are mean ± SEM. (A–C) For clicks, Friedman’s test with Dunn’s multiple comparisons test; for pure tones, repeated measures two-way ANOVA with Dunnett’s multiple comparisons test. (D–F) For clicks, Friedman’s test with Dunn’s multiple comparisons test; for pure tones, repeated-measures two-way ANOVA with Tukey’s multiple comparisons test. ∗p < 0.05, ∗∗p < 0.01, ∗∗∗p < 0.001, ∗∗∗∗p < 0.000; ns, not significant.
Figure 5
Figure 5
ABR wave-1 amplitude at 80 dB (μV) for clicks and pure tones All animals were exposed to an octave-band (8–16 kHz) stimulus at 100 dB for 1 h, represented by the gray area. α9L9′T-HA injected group N = 19 (magenta), uninjected group N = 14 (black), GFP-injected group N = 8 (green). Values are mean ± SEM. (A–C) 1, 7, and 14 days post-exposure comparisons between groups. Black asterisks for uninjected vs. α9L9′T-HA, magenta asterisks for GFP vs. α9L9′T-HA, green asterisks for GFP vs. uninjected. For clicks, ordinary one-way ANOVA with Tukey’s multiple comparisons test; for pure tones, two-way ANOVA with Tukey’s multiple comparisons test. (D–F) Within-group comparisons. Different-color intensities represent different time points, and same-color asterisks compare post-exposure time points to baseline of that group. For clicks, repeated-measures one-way ANOVA with Dunnett’s multiple comparisons test; for pure tones, repeated-measures two-way ANOVA with Dunnett’s multiple comparisons test. Non-significant (ns) points are indicators of protection or recovery from acoustic damage. Multiplicity adjusted p values of 14-day vs. baseline comparisons for clicks, 16 Hz, and 24 kHz are plotted. ∗p < 0.05, ∗∗p < 0.01, ∗∗∗p < 0.001, ∗∗∗∗p < 0.0001; ns, not significant.
Figure 6
Figure 6
Click wave-1 amplitude at 80 dB recovery over time Values are mean ± SEM. Repeated-measures two-way ANOVA with Tukey’s multiple comparisons test showed that at 14 days, the α9L9′T-HA group was significantly larger than the controls (α9L9′T-HA vs. uninjected p = 0.034, α9L9′T-HA vs. GFP p = 0.018), showing progressive recovery, with no significant difference between pre-exposure and 14-day values (p = 0.392). α9L9′T-HA-injected group N = 19 (magenta), uninjected group N = 14 (black), GFP-injected group N = 8 (green). Black asterisks for uninjected vs. α9L9′T-HA, magenta asterisks for GFP vs. α9L9′T-HA. ∗p < 0.05, ∗∗p < 0.01, ∗∗∗p < 0.001, ∗∗∗∗p < 0.0001; ns, not significant.
Figure 7
Figure 7
IHC afferent synapse counts (A) Synapses/IHCs for the apical, middle, and basal area of the left α9L9′T-HA-injected cochleas, the right uninjected α9L9′T-HA side, and the left cochleas of the uninjected group. Confocal images of every cochlear region, with 15–30 IHCs per image, were acquired. Co-localized immunolabeled CtBP2/PSD95 puncta were counted and divided by the number of IHC nuclei stained with DAPI. Mean ± maximum, minimum, and individual values. Two-way ANOVA showed no difference between groups in all cochlear regions. (Β) Representative maximum-intensity projection image of co-localized CtBP2 (green)/PSD95 (red) synaptic puncta from the left middle turn of an α9L9′T-HA-injected 7-week-old male C57Bl/J6 mouse. IHC nuclei are stained blue with DAPI, and cell margins are outlined with white dashed lines.

Update of

Similar articles

Cited by

References

    1. Chadha S., Kamenov K., Cieza A. The world report on hearing, 2021. Bull. World Health Organ. 2021;99 242–242A. - PMC - PubMed
    1. GBD 2019 Hearing Loss Collaborators Hearing loss prevalence and years lived with disability, 1990–2019: findings from the Global Burden of Disease Study 2019. Lancet (London, England) 2021;397:996–1009. - PMC - PubMed
    1. McDaid D., Park A.-L., Chadha S. Estimating the global costs of hearing loss. Int. J. Audiol. 2021;60:162–170. - PubMed
    1. Orji A., Kamenov K., Dirac M., Davis A., Chadha S., Vos T. Global and regional needs, unmet needs and access to hearing aids. Int. J. Audiol. 2020;59:166–172. - PubMed
    1. Scholes S., Biddulph J., Davis A., Mindell J.S. Socioeconomic differences in hearing among middle-aged and older adults: cross-sectional analyses using the Health Survey for England. BMJ Open. 2018;8 - PMC - PubMed

LinkOut - more resources