. 2025 Mar 8;4(2):e70011.
doi: 10.1002/imt2.70011. eCollection 2025 Apr.

iMLGAM: Integrated Machine Learning and Genetic Algorithm-driven Multiomics analysis for pan-cancer immunotherapy response prediction

Affiliations

iMLGAM: Integrated Machine Learning and Genetic Algorithm-driven Multiomics analysis for pan-cancer immunotherapy response prediction

Bicheng Ye et al. Imeta. .

Abstract

To address the substantial variability in immune checkpoint blockade (ICB) therapy effectiveness, we developed an innovative R package called integrated Machine Learning and Genetic Algorithm-driven Multiomics analysis (iMLGAM), which establishes a comprehensive scoring system for predicting treatment outcomes through advanced multi-omics data integration. Our research demonstrates that iMLGAM scores exhibit superior predictive performance across independent cohorts, with lower scores correlating significantly with enhanced therapeutic responses and outperforming existing clinical biomarkers. Detailed analysis revealed that tumors with low iMLGAM scores display distinctive immune microenvironment characteristics, including increased immune cell infiltration and amplified antitumor immune responses. Critically, through clustered regularly interspaced short palindromic repeats screening, we identified Centrosomal Protein 55 (CEP55) as a key molecule modulating tumor immune evasion, mechanistically confirming its role in regulating T cell-mediated antitumor immune responses. These findings not only validate iMLGAM as a powerful prognostic tool but also propose CEP55 as a promising therapeutic target, offering novel strategies to enhance ICB treatment efficacy. The iMLGAM package is freely available on GitHub (https://github.com/Yelab1994/iMLGAM), providing researchers with an innovative approach to personalized cancer immunotherapy prediction.

Keywords: genetic algorithms; gene‐pair; immune checkpoint blockade; immunotherapy; pan‐cancer.


Conflict of interest statement

The authors declare no conflicts of interest.

Figures

Figure 1
Figure 1
Development and validation of integrated Machine Learning and Genetic Algorithm‐driven Multiomics analysis (iMLGAM) score for predicting immunotherapy response. (A) Comprehensive flow chart detailing the systematic process of training, testing, and validation of the iMLGAM score, highlighting the integration of genetic algorithms (GAs) and ensemble learning methods for multi‐omics data analysis. (B–D) Comparative distribution of iMLGAM scores demonstrating clear differentiation between immunotherapy responders and nonresponders across training, testing, and independent validation cohorts, revealing the score's potential for treatment response stratification. (E–G) Receiver operating characteristic (ROC) curves illustrating the predictive accuracy of iMLGAM scores in identifying potential immunotherapy benefits, showcasing the method's robust performance across different patient cohorts. (H–J) Comparative performance analysis comparing iMLGAM scores against existing published molecular signatures, evaluated through area under the curve (AUC) metrics, demonstrating the novel approach's superior predictive capabilities in multiple independent datasets.
Figure 2
Figure 2
iMLGAM score associates with distinct immune signatures and molecular pathways. (A) The page of iMLGAM score web‐tool. (B) Volcano plot analysis depicting differential enrichment of 29 immune signatures between high and low iMLGAM score groups. Red points indicate signatures enriched in tumor tissue; blue points represent signatures enriched in normal tissue. (C) Gene set enrichment analysis (GSEA) comparing molecular pathways between high and low iMLGAM score groups. (D) Correlation matrix visualization of 29 immune signatures, comparing low iMLGAM score group (upper right panel) versus high iMLGAM score group (lower left panel). iMLGAM, integrated Machine Learning and Genetic Algorithm‐driven Multiomics analysis.
Figure 3
Figure 3
Clinical validation of iMLGAM score in the in‐house cohort. (A) Representative multiplex immunofluorescence images showing DAPI, CD4, CD8, and CD20 staining in high and low iMLGAM score groups. (B) Radiological assessment comparing pre‐ and post‐immunotherapy imaging in high and low iMLGAM score groups. (C) Baseline clinical characteristics of the in‐house cohort. (D) ROC curve analysis of iMLGAM score for predicting clinical response in the in‐house cohort. (E) iMLGAM score distribution between response and nonresponse groups.
Figure 4
Figure 4
Clustered regularly interspaced short palindromic repeats (CRISPR) screening and functional analysis of centrosomal protein 55 (CEP55) based on iMLGAM score. (A) Gene ranking by antitumor immunity knockout effects from 17 CRISPR datasets. (B) Univariate Cox regression analysis of high iMLGAM score prognostic genes, with CEP55 as the top candidate from CRISPR screen data. Migration and invasion assessment of CT26 (C) and 3LL (D) cells after CEP55 knockdown using Transwell assays. (E) Colony formation assays showing inhibition of cancer cell proliferation following CEP55 knockdown. (F) Flow cytometric analysis of apoptotic cell proportions in Colon Tumor 26 (CT26) and Lewis lung cancer cell line (3LL) cells after CEP55 knockdown.
Figure 5
Figure 5
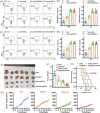
Impact of CEP55 knockdown on CD8+ T cell activity and tumor growth. (A) Flow cytometric analysis of IFN‐γ+ CD8+ T cells in CT26/3LL coculture systems with control short hairpin RNA (shNC) or CEP55‐targeting shRNA (shCEP55) transfection. (B) Quantitative analysis of IFN‐γ+ CD8+ T cells in CT26 and 3LL coculture systems. (C) Flow cytometric analysis of TNF‐α+ CD8+ T cells in coculture systems. (D) Quantitative analysis of TNF‐α+ CD8+ T cells in CT26 and 3LL coculture systems. (E) Tumor images from 3LL subcutaneous mouse model under shNC, shCEP55, and shCEP55+anti‐PD1 treatments. (F) Tumor weight comparison across treatment groups in 3LL model. (G) Kaplan–Meier survival analysis of 3LL tumor‐bearing mice under shNC, shCEP55, and anti‐PD1 treatments. (H) Tumor growth curves (mm³) for different treatment groups in 3LL model.

References

    1. Larkin, James , Chiarion‐Sileni Vanna, Gonzalez Rene, Grob Jean Jacques, Cowey C. Lance, Lao Christopher D., Schadendorf Dirk, et al. 2015. “Combined Nivolumab and Ipilimumab or Monotherapy in Untreated Melanoma.” New England Journal of Medicine 373: 23–34. 10.1056/NEJMoa1504030 - DOI - PMC - PubMed
    1. Tawbi, Hussein A. , Hodi F. Stephen, Lipson Evan J., Schadendorf Dirk, Ascierto Paolo A., Matamala Luis, and Gutiérrez Erika Castillo, et al. 2024. “Three‐Year Overall Survival With Nivolumab Plus Relatlimab in Advanced Melanoma From RELATIVITY‐047.” Journal of Clinical Oncology: JCO.24.01124. 10.1200/jco.24.01124 - DOI - PubMed
    1. Ai, Xinghao , Jia Bo, He Zhiyi, Zhang Junping, Zhuo Minglei, Zhao Jun, Wang Zhe, et al. 2024. “Noninvasive Early Identification of Durable Clinical Benefit From Immune Checkpoint Inhibition: A Prospective Multicenter Study (NCT04566432).” Signal Transduction and Targeted Therapy 9: 350. 10.1038/s41392-024-02060-3 - DOI - PMC - PubMed
    1. Yochum, Zachary A. , and Braun David A.. 2024. “Rechallenging With Anti‐PD‐1 Therapy in Advanced Renal Cell Carcinoma.” The Lancet 404: 1280–1282. 10.1016/S0140-6736(24)01866-X - DOI - PubMed
    1. Haslam, Alyson , and Prasad Vinay. 2019. “Estimation of the Percentage of US Patients With Cancer Who Are Eligible for and Respond to Checkpoint Inhibitor Immunotherapy Drugs.” JAMA Network Open 2: e192535. 10.1001/jamanetworkopen.2019.2535 - DOI - PMC - PubMed

LinkOut - more resources