. 2025 Apr 2:14:100649.
doi: 10.1016/j.ejro.2025.100649. eCollection 2025 Jun.

Ultrasound-based radiomics and machine learning for enhanced diagnosis of knee osteoarthritis: Evaluation of diagnostic accuracy, sensitivity, specificity, and predictive value

Affiliations

Ultrasound-based radiomics and machine learning for enhanced diagnosis of knee osteoarthritis: Evaluation of diagnostic accuracy, sensitivity, specificity, and predictive value

Takeharu Kiso et al. Eur J Radiol Open. .

Abstract

Purpose: To evaluate the usefulness of radiomics features extracted from ultrasonographic images in diagnosing and predicting the severity of knee osteoarthritis (OA).

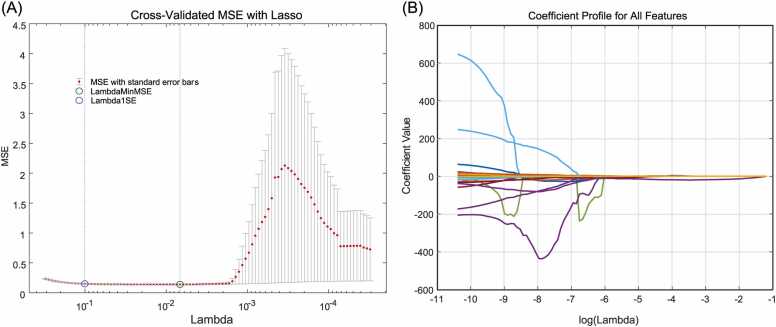
Methods: In this single-center, prospective, observational study, radiomics features were extracted from standing radiographs and ultrasonographic images of knees of patients aged 40-85 years with primary medial OA and without OA. Analysis was conducted using LIFEx software (version 7.2.n), ANOVA, and LASSO regression. The diagnostic accuracy of three different models, including a statistical model incorporating background factors and machine learning models, was evaluated.

Results: Among 491 limbs analyzed, 318 were OA and 173 were non-OA cases. The mean age was 72.7 (±8.7) and 62.6 (±11.3) years in the OA and non-OA groups, respectively. The OA group included 81 (25.5 %) men and 237 (74.5 %) women, whereas the non-OA group included 73 men (42.2 %) and 100 (57.8 %) women. A statistical model using the cutoff value of MORPHOLOGICAL_SurfaceToVolumeRatio (IBSI:2PR5) achieved a specificity of 0.98 and sensitivity of 0.47. Machine learning diagnostic models (Model 2) demonstrated areas under the curve (AUCs) of 0.88 (discriminant analysis) and 0.87 (logistic regression), with sensitivities of 0.80 and 0.81 and specificities of 0.82 and 0.80, respectively. For severity prediction, the statistical model using MORPHOLOGICAL_SurfaceToVolumeRatio (IBSI:2PR5) showed sensitivity and specificity values of 0.78 and 0.86, respectively, whereas machine learning models achieved an AUC of 0.92, sensitivity of 0.81, and specificity of 0.85 for severity prediction.

Conclusion: The use of radiomics features in diagnosing knee OA shows potential as a supportive tool for enhancing clinicians' decision-making.

Keywords: Knee joint; Machine learning; Osteoarthritis; Radiomics; Ultrasonography.


Conflict of interest statement

The authors declare that they have no known competing financial interests or personal relationships that could have appeared to influence the work reported in this paper.

Figures

Fig. 1
Fig. 1
Flowchart of the research procedure. ROI Segmentation: Image segmentation is performed on knee US images to extract radiomics features. Feature Extraction: Extracted radiomics features include shape features, statistical pixel value features, and histogram features. Feature Selection: ANOVA is used for statistical analysis, and LASSO is used for machine learning models. Prediction: diagnostic accuracy is evaluated and compared using area under the curve (AUC), accuracy, sensitivity, specificity, positive predictive value (PPV), negative predictive value (NPV), and F value as indices.
Fig. 2
Fig. 2
Specific examples of segmentation performed for radiomics feature extraction. A: non-OA (KL1), B: clinical OA (KL2), C: severe OA (KL4); F: femur, T: tibia, Prox: proximal, Dist: distal, *: medial meniscus, △: medial collateral ligament.
Fig. 3
Fig. 3
Flowchart of case selection. ACL, anterior cruciate ligament; OA, knee osteoarthritis; US, ultrasonography.
Fig. 4
Fig. 4
Comparison of ROC curves of statistical models using radiomics features and background factors for clinical OA diagnosis. Model 1 (using only radiomics features): Uses radiomics features extracted from images. Model 2 (Radiomics + use of background factors): In addition to Radiomics, this model combines age, sex, and BMI. Model 3 (using only background factors): model using only age, sex, and BMI.
Fig. 5
Fig. 5
Comparison of ROC curves of statistical models using radiomics features and background factors in predicting OA severity. Model 1 (using only radiomics features): Uses radiomics features extracted from images. Model 2 (Radiomics + background factor use): A model that combines BMI in addition to Radiomics. Model 3 (using only background factors): Model using only BMI.
Fig. 6
Fig. 6
Results of LASSO regression for clinical OA diagnosis. (A) shows the variation of the mean squared error (MSE) based on the cross-validation results of the LASSO regression. The horizontal axis represents the regularization parameter λ and the vertical axis represents the MSE obtained from cross-validation. The blue circle is the λ of the minimum MSE (LambdaMinMSE) and the green circle is the λ of the 1-SE criterion (Lambda1SE). (B) shows the variation of the coefficients of each feature in the Lasso regression. The horizontal axis represents the log scale of λ (log(λ)), and the vertical axis represents the coefficient value of each feature.
Fig. 7
Fig. 7
ROC curve comparison of machine learning models with radiomics features and background factors for clinical OA diagnosis (test data). Model 1 (using only radiomics features): Uses radiomics features extracted from images. Model 2 (Radiomics + use of background factors): In addition to Radiomics, this model combines age, sex, and BMI. Model 3 (using only background factors): model using only age, sex, and BMI. RF, Random Forest; DA, Discriminant Analysis; LR, Logistic Regression; NBC, Naive Bayes Classifier; SVM, Support Vector Machine; KNN; K-Nearest Neighbors.
Fig. 8
Fig. 8
Results of LASSO regression in predicting OA severity. (A) shows the variation of the mean squared error (MSE) based on the cross-validation results of the LASSO regression. The horizontal axis represents the regularization parameter λ and the vertical axis represents the MSE obtained from cross-validation. The blue circle is the λ of the minimum MSE (LambdaMinMSE) and the green circle is the λ of the 1-SE criterion (Lambda1SE). (B) shows the variation of the coefficients of each feature in the Lasso regression. The horizontal axis represents the log scale of λ (log(λ)), and the vertical axis represents the coefficient value of each feature.
Fig. 9
Fig. 9
ROC curve comparison of machine learning models with radiomics features and background factors in predicting clinical OA severity (test data). Model 1 (using only radiomics features): Uses radiomics features extracted from images. Model 2 (Radiomics + background factor use): A model that combines BMI in addition to Radiomics. Model 3 (using only background factors): Model using only BMI. RF, Random Forest; DA, Discriminant Analysis; LR, Logistic Regression; NBC, Naive Bayes Classifier; SVM, Support Vector Machine; KNN; K-Nearest Neighbors.
Fig. 10
Fig. 10
Flowchart for diagnosis and severity classification of knee OA. DA, Discriminant Analysis; LR, Logistic Regression.

Similar articles

Cited by

References

    1. Taylor N. Nonsurgical management of osteoarthritis knee pain in the older adult: an update. Rheum. Dis. Clin. N. Am. 2018;44:513–524. doi: 10.1016/j.rdc.2018.03.009. - DOI - PubMed
    1. Loeser R.F., Goldring S.R., Scanzello C.R., Goldring M.B. Osteoarthritis: a disease of the joint as an organ. Arthritis Rheum. 2012;64:1697–1707. doi: 10.1002/art.34453. - DOI - PMC - PubMed
    1. Sasaki E., Ota S., Chiba D., Kimura Y., Sasaki S., Yamamoto Y., Tsuda E., Nakaji S., Ishibashi Y. Early knee osteoarthritis prevalence is highest among middle-aged adult females with obesity based on new set of diagnostic criteria from a large sample cohort study in the Japanese general population. Knee Surg. Sports Traumatol. Arthrosc. 2020;28:984–994. doi: 10.1007/s00167-019-05614-z. - DOI - PubMed
    1. Landsmeer M.L.A., Runhaar J., van Middelkoop M., Oei E.H.G., Schiphof D., Bindels P.J.E., Bierma-Zeinstra S.M.A. Predicting knee pain and knee osteoarthritis among overweight women. J. Am. Board Fam. Med. 2019;32:575–584. doi: 10.3122/jabfm.2019.04.180302. - DOI - PubMed
    1. Hrnack S.A., Barber F.A. Managing the pain of knee osteoarthritis. Phys. Sport. 2014;42:63–70. doi: 10.3810/psm.2014.09.2077. - DOI - PubMed

LinkOut - more resources