. 2025 Jul 15;64(14):3015-3029.
doi: 10.1021/acs.biochem.4c00663. Epub 2025 Apr 16.

Biochemical and Biophysical Divergences between Two Escherichia coli l-Asparaginase II Variants: Potential for Using EcA2-K12 as a Biosimilar

Affiliations

Biochemical and Biophysical Divergences between Two Escherichia coli l-Asparaginase II Variants: Potential for Using EcA2-K12 as a Biosimilar

Talita Stelling de Araujo et al. Biochemistry. .

Abstract

Escherichia coli l-asparaginase II (EcA2) is essential for treating Acute Lymphoblastic Leukemia, the most common childhood cancer. This enzyme catalyzes the hydrolysis of l-asparagine or l-glutamine to ammonia and l-aspartate or l-glutamate. The first FDA-approved EcA2 biopharmaceutical, Elspar, was introduced in 1978, followed by other biosimilars. Despite stringent approval criteria, variations in plasmatic activity and therapeutic efficacy persist across different EcA2 preparations, often leading to substandard product notifications. Many studies focus on the EcA2 from the E. coli K12 strain (EcA2-K12), which differs by four amino acids from reference biopharmaceuticals, including Elspar (EcA2-4M). Here, we show that EcA2-4 M has over twice the specific activity on both the hydrolysis of l-asparagine and on human lymphoblast cells compared to EcA2-K12. EcA2-K12 demonstrates 4-fold greater specificity for l-asparagine over l-glutamine, considering their kcat, but similar KM toward each amino acid. Interestingly, EcA2-K12 has 3-fold lower affinity for l-aspartate, linked to reduced stabilization of its N-terminal active site loop. Although both variants exhibit indistinguishable thermostability, EcA-K12 shows a higher tendency to oligomerize. We solved the 3D structures of both variants by X-ray crystallography, and normal-mode analysis revealed wider conformational changes in EcAK12's active site. Our data indicate that EcA2-K12 has lower activity due to the higher conformational dynamics of the N-terminal active site loop. Nevertheless, EcA2-K12 is a beneficial alternative or complement to existing therapeutic schemes with EcA2-4M, due to its higher specificity to l-asparagine, which is of fundamental importance since activity on l-glutamine is associated with harmful side effects.


Figures

1
1
Amino acid sequences of EcA2-K12 and EcA2-4M. The four amino acid differences between the variants EcA2-K12 and EcA2-4 M are shown in blue and red, respectively. The flexible N-terminal loop boundaries of EcA2 are indicated in the figure. Residues that form the catalytic site are highlighted with yellow boxes, with those directly involved in catalysis indicated by stars. The N-terminal domain amino acids are underlined, while the C-terminal domain is shaded in gray.
2
2
Activity of EcA2-4 M is significantly higher than EcA2-K12. (A) The specific activity of l-Asn hydrolysis was measured with l-asparaginase at 25 °C and pH 8.0. Bars represent the mean, and the error bars indicate the standard deviations. Statistical significance determined using the Holm–Sidak method, with alpha = 0.05 (n = 9). (B) The effect of l-asparaginases on cells. The experimental data were fit to a dose response equation with variable slope, shown in Figure S3 (n = 3, R 2 = 0.92 and 0.97 for EcA2-K12 and EcA2-4M, respectively) Bars represent the mean, and the error bars indicate the standard deviations. (C,D) Kinetics of 160 μM l-Asn hydrolysis measured by NMR at 25 °C and pH 8.0 (n = 4). (E,F) Kinetics of 640 μM l-Gln hydrolysis measured by NMR at 25 °C and pH 8.0 (n = 4). Standard deviations were calculated from independent fits of four experimental data sets.
3
3
Affinity for l-Asp is higher for EcA2-4M than EcA2-K12. (A) Binding of l-Asp to EcA2-4M (red, n = 3) or EcA2-K12 (blue, n = 3) determined by intrinsic tryptophan fluorescence. Standard deviations for the mean K D values were calculated from independent fits of three experimental data sets for each EcA2 variant. (B,C) Multiple displays of NMR-titration analysis of EcA2-4M (red) or EcA2-K12 (blue) at 160 μM supplemented with increasing concentrations of l-Asp. Concentration of l-Asp used for the acquisition of each spectrum is indicated in the figure. For each experiment, a total of 256 scans with 2 s of relaxation delay were collected in a 600 MHz spectrometer at 298 K. Asterisks indicate the peaks of two aromatic protons previously attributed to Y25.
4
4
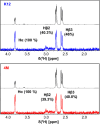
STD-NMR analyses reveal that binding epitope of l-Asp to EcA2-4M e EcA2-K12 is very similar. The reference spectrum acquired for each ligand is in black, and the corresponding STD-NMR spectrum is colored in blue (EcA2-K12) or red (EcA2-4M). The assigned protons are indicated in each spectrum with the respective relative STD percentages in parentheses.
5
5
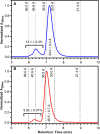
EcA2-4M exhibits a distinct oligomeric distribution compared to EcA2-K12. Analytical size-exclusion chromatography was performed on EcA2-K12 (A) and EcA2-4M (B). The elution profiles of protein standards are indicated by dashed lines, along with their respective hydrodynamic radii. The standard curve correlating the retention time with the hydrodynamic radii of the standards is shown in Figure S7. The hydrodynamic radius (Å) of the main peak the estimated abundance (% of total peak area) of high molecular weight species (pré-peaks), and their standard deviations from three independent measurements are indicated in the graph.
6
6
Solution conformation and thermal stability of EcA2-K12 and EcA2-4M are similar. (A) Circular dichroism spectra recorded with proteins at 25 °C (solid lines) or 80 °C (dots). (B) Normalized intrinsic fluorescence spectra recorded at 25 °C (solid lines) or 70 °C (dots). (C) Amide and aromatic region of 1D [1H]-NMR spectra. NMR spectra were collected at 25 °C and 900 MHz. (D) The unfolded fraction of EcA2 variants at different temperatures was determined by measuring intrinsic fluorescence intensities at 348 nm in normalized spectra (Figure S6). Experimental data were fitted to a two-state model equation with baseline correction (R 2 > 0.99).
7
7
Conformational plasticity evaluation by ion mobility spectrometry–mass spectrometry. ESI-IMS-MS reveals multiple l-asparaginase conformers. EcA2-K12 (A–D) and EcA2-4M (E–H) were evaluated at 5 μM in 0.1% formic acid in water/acetonitrile (50:50). Multiple monomeric conformational states were populated, such as two (C,G) or three (D,H) conformers in the same sample. The deconvoluted spectra revealed a mass of 34,590.0 Da for both EcA2-K12 and EcA2-4M, in agreement with previous data from Aginasa (similar as Elspar) and as expected from the cloned genes.
8
8
Comparison of crystal structures of EcA2-K12 and EcA2-4M. (A) The chain A of EcA2-K12 (blue) is superimposed with chain A of EcA2-4M (red). The amino acid chain termini are indicated, as well as the loop (lid) that covers the active site and the l-Asp bound to it. Cα RMSD of chain alignment by amino acid residue number of (B) EcA2-K12 chains, A vs B (orange); A vs C (magenta); A vs D (green). (C) EcA2-4M chains, A vs B (red). (D) EcA2-4M chain A vs EcA2-K12 chain A (black).
9
9
Comparison of the conformation of the nonmatching residues of EcA2-K12 and EcA2-4M. EcA2-4M (red) and EcA2-K12 (blue) are at the same orientation to compare the structures near the nonmatching residues.
10
10
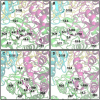
Closeup of the active site showing the open and closed conformations calculated by the normal-mode analysis. (A) EcA2-4M open state. (B) EcA2-K12 open state (C) EcA2-4M close state. (D) EcA2-K12 close state. Each chain is identified by different colors (Greenchain A; Cyanchain B; Purplechain C; Yellowchain D). The distances (Å) to selected amino acids are indicated.
11
11
RMSD taken from the normal-mode trajectory file plotted by amino acid number. The graphs present the difference in Å between the structure in equilibrium and the final state, for EcA2-4M (red) or EcA2-K12 (blue). (A) Chain A. (B) Chain B (C) Chain C. (D) Chain D.

Similar articles

References

    1. World Health Organization . Model List of Essential Medicines for Children9th List; World Health Organization: Geneva, 2023.
    1. Allemani C., Weir H. K., Carreira H., Harewood R., Spika D., Wang X.-S., Bannon F., Ahn J. V., Johnson C. J., Bonaventure A., Marcos-Gragera R., Stiller C., Azevedo e Silva G., Chen W.-Q., Ogunbiyi O. J., Rachet B., Soeberg M. J., You H., Matsuda T., Bielska-Lasota M., Storm H., Tucker T. C., Coleman M. P.. Global surveillance of cancer survival 1995–2009: analysis of individual data for 25 676 887 patients from 279 population-based registries in 67 countries (CONCORD-2) Lancet. 2015;385:977–1010. doi: 10.1016/S0140-6736(14)62038-9. - DOI - PMC - PubMed
    1. Hill J. M., Roberts J., Loeb E., Khan A., MacLellan A., Hill R. W.. L-asparaginase therapy for leukemia and other malignant neoplasms. Remission in human leukemia. JAMA. 1967;202:882–888. doi: 10.1001/jama.1967.03130220070012. - DOI - PubMed
    1. Heo Y.-A., Syed Y. Y., Keam S. J.. Pegaspargase: A Review in Acute Lymphoblastic Leukaemia. Drugs. 2019;79:767–777. doi: 10.1007/s40265-019-01120-1. - DOI - PMC - PubMed
    1. Faschinger A. M., Sessler N.. Development of a Lyophilized Formulation of Pegaspargase and Comparability Versus Liquid Pegaspargase. Adv. Ther. 2019;36:2106–2121. doi: 10.1007/s12325-019-00988-5. - DOI - PMC - PubMed

MeSH terms

LinkOut - more resources