. 2025 Apr;14(4):e70071.
doi: 10.1002/jev2.70071.

Small Extracellular Vesicle-Derived Nicotinamide Phosphoribosyltransferase (NAMPT) Induces Acyl-Coenzyme A Synthetase SLC27A4-Mediated Glycolysis to Promote Hepatocellular Carcinoma

Affiliations

Small Extracellular Vesicle-Derived Nicotinamide Phosphoribosyltransferase (NAMPT) Induces Acyl-Coenzyme A Synthetase SLC27A4-Mediated Glycolysis to Promote Hepatocellular Carcinoma

Cherlie Lot Sum Yeung et al. J Extracell Vesicles. 2025 Apr.

Abstract

Tumour-derived small extracellular vesicles (sEV) are critical mediators within the tumour microenvironment (TME) and are known to regulate various metabolic pathways. In metastatic hepatocellular carcinoma (HCC), mass spectrometry protein analysis of HCC-derived sEV (HCC-sEV) identified an upregulation of nicotinamide phosphoribosyltransferase (NAMPT), a key enzyme in maintaining cellular nicotinamide adenine dinucleotide (NAD+) levels. Our study demonstrates that sEV-NAMPT enhances glycolysis, tumorigenesis, and metastasis in HCC. Specifically, sEV-NAMPT activates the NF-κB transcription factor through toll-like receptor 4 (TLR4), leading to elevated SLC27A4 expression. SLC27A4 functions primarily as a long-chain fatty acid transporter and acyl-CoA synthetase. Lipidomic and metabolomic analyses revealed a positive correlation between SLC27A4 and intracellular levels of triacylglycerol (TG) and dihydroxyacetone phosphate (DHAP). Increased TG levels enhance lipolysis via hepatic lipase and facilitate the conversion of glycerol-3-P to DHAP, an intermediate that bridges lipid metabolism and glycolysis. This study uncovers a novel regulatory axis involving sEV-NAMPT and SLC27A4 in glycolysis, independent of traditional fatty acid metabolism pathways. Clinically, targeting sEV-NAMPT with the inhibitor FK866 significantly inhibited tumour growth in various HCC in vivo models, highlighting the potential of sEV-NAMPT as both a biomarker and therapeutic target in HCC.


Conflict of interest statement

The authors declare no conflicts of interest.

Figures

FIGURE 1
FIGURE 1
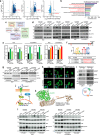
Metastatic HCC cell‐derived sEVs facilitate HCC cell glycolysis and promote the cancerous properties of recipient cells. (a) The size distribution of sEV derived from MHCC97L and MHCCLM3 cells was measured using a nanoparticle tracking analyser. (b) Representative electron micrographs of sEV subjected to immunogold labelling using anti‐CD63 antibodies followed by secondary antibodies coupled to 10‐nm gold particles (upper panel). Scale bar, 100 nm; magnification, 52,000×. sEV morphology was shown by negative staining (lower panel). PLC/PRF/5 (c) and HLE (d) cells treated with the indicated sEV were subjected to colony formation, migration and invasion assays. Representative images of colonies and cells are shown. The numbers of colonies and cells were quantified. (e and f) sEV from MHCC97L, MHCCLM3 and MIHA cells were analysed via proteomics mass spectrometry analysis. The upregulated proteins in MHCC97L‐ and MHCCLM3‐sEV compared to those in MIHA‐sEV (fold change > 2, p < 0.05) were identified. (e) Venn diagram showing upregulated proteins in MHCC97L‐ and MHCCLM3‐sEV. (f) Pathway analysis of the commonly upregulated proteins using Gene Ontology (GO) biological process and Kyoto Encyclopedia of Genes and Genomes (KEGG) databases. (g) Seahorse glycolytic rate assay was used to monitor real‐time changes in the ECAR of PLC/PRF/5 and HLE cells treated with the indicated sEV. The additions of rotenone/antimycin A (Rot/AA) and 2‐deoxyglucose (2‐DG) are indicated. (h) The measured glycoPER is shown. The data are expressed as the mean ± SEM. ****p < 0.0001, ***p < 0.001, **p < 0.01, *p < 0.05.
FIGURE 2
FIGURE 2
Upregulation of NAMPT in the sEV of metastatic HCC cells and circulating sEV of HCC patients. (a) Volcano plots depicting the proteins differentially expressed between MHCC97L‐sEV (left) and MHCCLM3‐sEV (right) versus MIHA‐sEV. (b) The top 10 upregulated proteins identified in MHCC97L‐sEV, ranked by fold change, are presented. The corresponding fold changes in expression in MHCCLM3‐sEV are listed. (c) Immunoblotting of NAMPT, positive sEV markers (TSG101 and CD9) and negative sEV markers (cis‐Golgi marker GM130 and nucleoporin p62) in total cell lysates (TCLs) and sEV. (d) Analysis of NAMPT levels in sEV derived from cell lines using ELISA. (e) Analysis of the NAMPT level in circulating sEV from control individuals (n = 30) and patients with HBV (n = 20), cirrhosis (n = 9) or HCC (n = 53) using ELISA. (f) Analysis of NAMPT levels in circulating sEV from HCC patients collected before and after surgery (n = 19). The data are presented as the means ± SEMs. ***p < 0.001. NS, not significant.
FIGURE 3
FIGURE 3
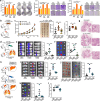
Knockdown of NAMPT in sEV derived from metastatic HCC cells reduces the promoting effect on glycolysis and cancer phenotypes in recipient cells. (a) Immunoblotting of NAMPT, sEV‐positive and sEV‐negative markers in total cell lysate (TCL) and sEV from CTL‐KD and NAMPT‐KD cells established from MHCC97L and MHCCLM3 cells. (b) Seahorse glycolytic rate assay was used to monitor real‐time changes in the ECAR of PLC/PRF/5 and HLE cells treated with the indicated sEV. The additions of rotenone/antimycin A (Rot/AA) and 2‐deoxyglucose (2‐DG) are indicated. (c) The measured glycoPER is shown. (d) PLC/PRF/5 cells were subcutaneously co‐injected with the indicated sEV into mice. The tumour volume was monitored twice per week. (e) Photograph of excised tumours is shown. Tumour weights and dimensions were measured. (f) Mice were intravenously injected with murine p53−/−;Myc hepatoblasts and the indicated sEV. Two weeks after injection, bioluminescence imaging was performed. (g) Ex vivo bioluminescence imaging of excised lung tissues. The luciferase signal was quantified. (h) Representative H&E‐stained micrographs showing tumour nodules in the lungs (indicated by arrowheads). Inlets show enlarged images. Scale bar, 200 µm. The data are expressed as the mean ± SEM. ****p < 0.0001, ***p < 0.001, **p < 0.01, *p < 0.05.
FIGURE 4
FIGURE 4
sEV‐NAMPT regulates SLC27A4 through TLR4‐dependent NF‐κB activation. (a) HLE cells were treated with PBS, CTL‐KD‐sEV or NAMPT‐KD‐sEV derived from MHCC97L cells and subjected to proteomic analysis. Volcano plots depicting the differentially expressed proteins (DEPs) in cells treated with CTL‐KD‐sEV versus NAMPT‐KD1‐sEV (left), CTL‐KD‐sEV versus PBS (middle), and NAMPT‐KD1‐sEV versus PBS (right). (b) Gene Ontology (GO) analysis of the upregulated proteins (fold change > 2, p < 0.05). Biological processes related to lipid metabolism were identified and are highlighted in red. (c) The proteins involved in the identified processes in the GO analysis are listed. (d) Immunoblotting of p‐p65, total p65 and SLC27A4 in HLE and PLC/PRF/5 cells treated with the indicated sEV. β‐Actin was used as an internal control. (e) Quantitative PCR analysis of SLC27A4 levels in cells subjected to the same treatment as described in (d). (f) Illustration showing three putative NF‐κB binding sites in the promoter region upstream of the SLC27A4 transcription start site (TSS). The NF‐κB binding motif, interacting nucleotides (red) and binding significance are shown. (g) Immunoblotting of p65 in the cytoplasmic and nuclear fractions of cells upon sEV treatment. c‐Jun and GAPDH were used as nuclear and cytoplasmic markers, respectively. (h) Representative immunofluorescence images of p65 (green) in cells treated with the indicated sEV are shown. Nuclei were counterstained with DAPI (blue) and are shown in the inserts. Scale bar, 50 µm. (i) Immunoblotting of NAMPT and sEV marker expression in sEV treated with or without proteinase K (upper panel). The localization of NAMPT and sEV markers is illustrated in the diagram (lower panel). (j) A schematic diagram depicting the proposed pathway through which sEV‐NAMPT activates NF‐κB‐mediated SLC27A4 transcription through TLR4. (k) Binding analysis of NAMPT and TLR4 using HDOCK. (l) Immunoblotting of TLR4, p‐p65, total p65 and SLC27A4 (indicated by arrowhead) in CTL‐KD and TLR4‐KD cells treated with the indicated sEV. A non‐specific band is marked by an asterisk. β‐Actin was used as an internal control. The data are expressed as the mean ± SEM. ****p < 0.0001, ***p < 0.001, **p < 0.01, *p < 0.05.
FIGURE 5
FIGURE 5
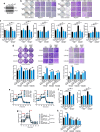
Knockdown of TLR4 reduces the responsiveness of cells to the oncogenic activity of sEV‐NAMPT. (a) Immunoblotting of TLR4 in CTL‐KD and TLR4‐KD PLC/PRF/5 cells. (b) PLC/PRF/5 CTL‐KD and TLR4‐KD cells treated with sEV derived from metastatic HCC cells (97L‐sEV and LM3‐sEV) were subjected to colony formation, migration and invasion assays. Representative images of colonies and cells are shown. (c) The numbers of colonies and cells were quantified. (d) PLC/PRF/5 CTL‐KD and TLR4‐KD cells treated with PBS, CTL‐SAM‐sEV or NAMPT‐SAM‐sEV were subjected to in vitro functional assays. (e) Analysis of the ECAR of PLC/PRF/5 CTL‐KD and TLR4‐KD cells treated with sEV derived from metastatic HCC cells (97L‐sEV and LM3‐sEV). (f) The measured glycoPER is shown. (g) PLC/PRF/5 CTL‐KD and TLR4‐KD cells treated with PBS, CTL‐SAM‐sEV or NAMPT‐SAM‐sEV were subjected to an ECAR assay. (h) GlycoPER was measured. The additions of rotenone/antimycin A (Rot/AA) and 2‐deoxyglucose (2‐DG) are indicated. The data are expressed as the mean ± SEM. ****p < 0.0001, ***p < 0.001, **p < 0.01, *p < 0.05. NS, not significant.
FIGURE 6
FIGURE 6
SLC27A4 is overexpressed in HCC and acts as a regulator of cell growth, motility and glycolysis induced by sEV‐NAMPT cells. (a) The relative expression of SLC27A4 in 50 paired non‐tumour and tumour samples from the TCGA‐LIHC cohort (left). K‒M plots showing the disease‐free survival (middle) and overall survival (right) between patients with high and low SLC27A4 expression (classified by median) in the TCGA‐LIHC cohort. p values were obtained by log‐rank tests. (b) Immunoblotting confirming the knockdown of SLC27A4 in PLC/PRF/5 cells. β‐Actin was included as an internal control. Colony formation, migration and invasion assays of PLC/PRF/5 CTL‐KD and SLC27A4‐KD cells treated with sEV derived from MHCC97L (97L‐sEV) (c) and MHCCLM3 (LM3‐sEV) (d) cells. Representative images of colonies and cells are shown. The numbers of colonies and cells were quantified. (e) PLC/PRF/5 CTL‐KD and SLC27A4‐KD cells were subcutaneously co‐injected with 97L‐sEV into mice. The tumour volume was monitored regularly. (f) A photograph of excised tumours is shown. Tumour weights and dimensions were measured. (g) PLC/PRF/5 CTL‐KD and SLC27A4‐KD cells treated with PBS or 97L‐sEV were subjected to ECAR analysis, and the glycoPER was measured. (h) PLC/PRF/5 CTL‐KD and SLC27A4‐KD cells treated with PBS, CTL‐SAM‐sEV or NAMPT‐SAM‐sEV were subjected to ECAR and glycoPER measurements. The additions of rotenone/antimycin A (Rot/AA) and 2‐deoxyglucose (2‐DG) are indicated. The data are expressed as the mean ± SEM. ****p < 0.0001, ***p < 0.001, **p < 0.01, *p < 0.05. NS, not significant.
FIGURE 7
FIGURE 7
Knocking down SLC27A4 in HCC significantly reduces hepatic TG levels. (a) Schematic illustration of the dual role of SLC27A4 as a fatty acid transporter and an acyl‐CoA synthetase. (b) Changes in fatty acid (FA) uptake in CTL‐KD and SLC27A4‐KD cells established from PLC/PRF/5 and HLE cells after treatment with 97L‐sEV. (c) Heatmap showing the changes in different lipid classes in PLC/PRF/5 and HLE cells after SLC27A4 knockdown. (d) Relative level of AcCa and TG in CTL‐KD and SLC27A4‐KD cells. (e) Heatmap depicting the changes in TG levels in PLC/PRF/5 and HLE cells after SLC27A4 knockdown. (f) The livers of nude mice were orthotopically implanted with PLC/PRF/5 CTL‐KD or SLC27A4‐KD cells. Six weeks after injection, bioluminescence imaging was performed. (g) Ex vivo bioluminescence imaging of excised liver tissues. The luciferase signal was quantified. (h) Immunohistochemical staining of SLC27A4 in liver tissues. (i) Representative micrographs of Oil Red O‐stained (red) liver tumour sections and the quantification of Oil Red O staining are shown. Scale bar, 100 µm. (j) TG levels in excised liver tumours were analysed. (k) The CTL‐KD and SLC27A4‐KD cells were subjected to metabolite profiling. The quantification of intermediates in CTL‐KD and SLC27A4‐KD cells is presented. (l) An illustration of metabolite intermediates involved in the glycolysis pathway. The data are expressed as the mean ± SEM. ****p < 0.0001, ***p < 0.001, **p < 0.01, *p < 0.05, NS, not significant.
FIGURE 8
FIGURE 8
The NAMPT inhibitor reduces the promoting effect of HCC cell‐derived sEV. (a) Colony formation, migration and invasion assays of PLC/PRF/5 cells treated with PBS, 97L‐sEV or LM3‐sEV with or without FK866 (2.5 nM) for 24 h. Representative images of colonies and cells are shown. The numbers of colonies and cells were quantified. (b) A schematic diagram of the tumour xenograft model in which PLC/PRF/5 cells were co‐injected subcutaneously with 97L‐sEV together with or without FK866 (5 mg/kg mouse body weight). (c) Tumour volumes were monitored twice per week. A photograph of the excised tumours is shown. Tumour weights and dimensions were measured. (d) A schematic diagram of the lung colonization model. Mice were intravenously injected with murine p53−/−;Myc hepatoblasts with or without 97L‐sEV or FK866 (10 mg/kg mouse body weight). Two weeks after injection, bioluminescence imaging of the animals (e) and excised liver tissues (f) was performed. The luciferase signal was quantified. (g) Representative H&E‐stained micrographs showing tumour nodules in the lungs (indicated by arrowheads). Inlets show enlarged images. Scale bar, 200 µm. (h) An illustration of orthotopic liver implantation, sEV education and FK866 treatment. The livers of the mice were implanted with PLC/PRF/5 cells. After 3 weeks, the mice were injected via the tail vein with LM3‐sEV along with DMSO or FK866 (10 mg/kg mouse body weight) once per week for three consecutive weeks. Two weeks after tumour implantation, bioluminescence imaging of the animals (i), excised liver tissues (j) and lung tissues (k) was performed. The luciferase signal was quantified. (l) TG levels in excised liver tumours were analysed. The data are expressed as the mean ± SEM. ***p < 0.001, **p < 0.01, *p < 0.05.

Similar articles

References

    1. Abhange, K. , Makler A., Wen Y., et al. 2021. “Small Extracellular Vesicles in Cancer.” Bioactive Materials 6: 3705–3743. - PMC - PubMed
    1. Amann, T. , Maegdefrau U., Hartmann A., et al. 2009. “GLUT1 Expression Is Increased in Hepatocellular Carcinoma and Promotes Tumorigenesis.” American Journal of Pathology 174: 1544–1552. - PMC - PubMed
    1. Anderson, C. M. , and Stahl A.. 2013. “SLC27 Fatty Acid Transport Proteins.” Molecular Aspects of Medicine 34: 516–528. - PMC - PubMed
    1. Arima, Y. , Liu W., Takahashi Y., Nishikawa M., and Takakura Y.. 2019. “Effects of Localization of Antigen Proteins in Antigen‐Loaded Exosomes on Efficiency of Antigen Presentation.” Molecular Pharmaceutics 16: 2309–2314. - PubMed
    1. Basak, M. , Chaudhary D. K., Takahashi R.‐U., et al. 2022. “Immunocyte Derived Exosomes: Insight Into the Potential Chemo‐Immunotherapeutic Nanocarrier Targeting the Tumor Microenvironment.” ACS Biomaterials Science & Engineering 9: 20–39. - PubMed

Substances

LinkOut - more resources