. 2025 Apr;31(4):e70379.
doi: 10.1111/cns.70379.

Alleviation of Microglia Mediating Hippocampal Neuron Impairments and Depression-Related Behaviors by Urolithin B via the SIRT1-FOXO1 Pathway

Affiliations

Alleviation of Microglia Mediating Hippocampal Neuron Impairments and Depression-Related Behaviors by Urolithin B via the SIRT1-FOXO1 Pathway

Cuilan Liu et al. CNS Neurosci Ther. 2025 Apr.

Abstract

Aims: Conventional antidepressants exhibit limited efficacy and delayed onset. This study aimed to elucidate the antidepressant effects of urolithin B (UB) and its regulatory role in microglia-mediated hippocampal neuronal dysfunction.

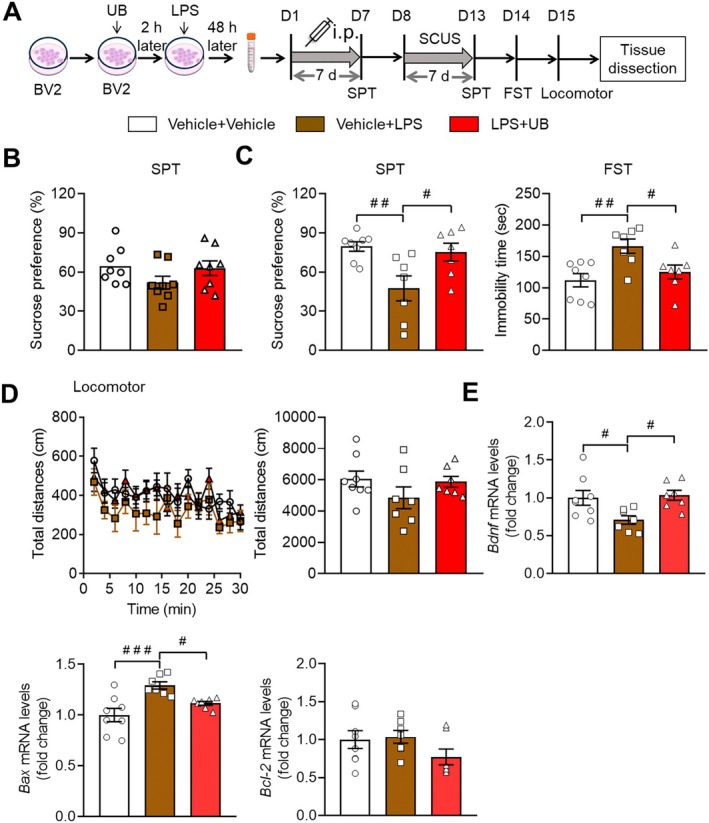
Methods: The mouse model of depression was established using both chronic unpredicted stress (CUS) and lipopolysaccharide (LPS) injection. The therapeutic efficacy of UB was assessed through behavioral paradigms. The microglia activation, cellular cytotoxicity and apoptosis levels, and underlying molecular mechanisms were delineated utilizing proteomics analysis, immunofluorescence staining, real-time PCR and Western blotting.

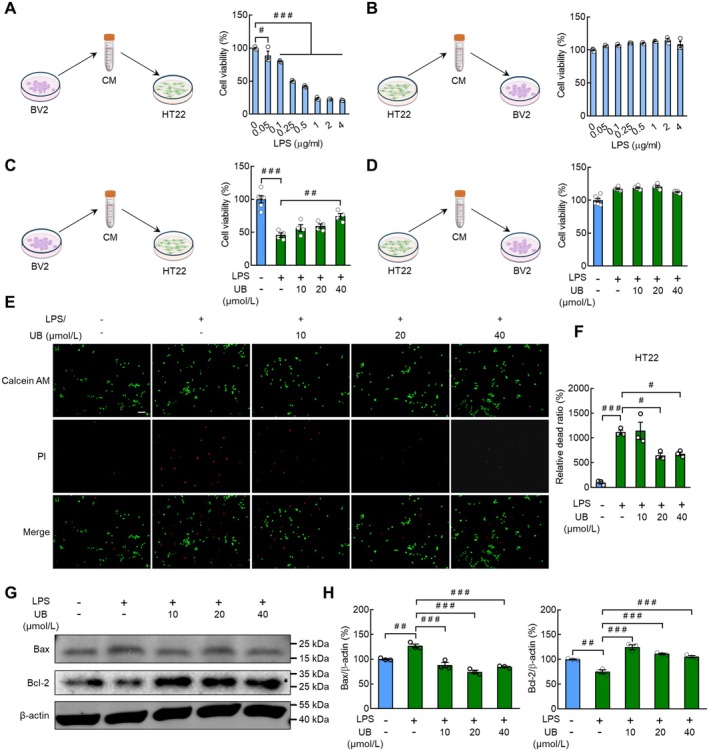
Results: UB efficiently alleviated depression-related behaviors, accompanied by suppressed microglia activation, neuroinflammation, changes of classic activation (M1)/alternative activation (M2) polarization and recovered sirtuin-1 (SIRT1) and forkhead box protein O1 (FOXO1) expression in the hippocampus. Additionally, UB reduced the cytotoxicity and apoptosis of HT22 cells and depression-related phenotypes treated by the cellular supernatant from LPS-incubated BV2 cells, which was mediated by the SIRT1-FOXO1 pathway. The proteomics analysis of the cellular supernatant content revealed abundant secreting proteins among the LPS/UB application.

Conclusion: This study confirmed that microglial SIRT1 mediates UB's antidepressant effects, positioning UB as a promising therapeutic candidate for depression by targeting neuroinflammatory pathways.

Keywords: FOXO1; SIRT1; cytotoxicity; depression; neuroinflammation; urolithin B.


Conflict of interest statement

The authors declare no conflicts of interest.

Figures

FIGURE 1
FIGURE 1
UB ameliorates CUS‐induced depressive behaviors, neuroinflammation and abnormal expression of SIRT1 and FOXO1 in hippocampus. (A) Schematic representation of the CUS procedure and treatments in mice. SPT, sucrose preference test; FST, forced swimming test; FUST, Female urine sniffing test; i.p., intraperitoneal injection. (B) SPT, FST, FUST and locomotor test. (C) Immunofluorescence micrographs of microglia immunostaining for Iba1. Iba1+ microglia are colored red, and nuclei are stained with DAPI (blue). Scale bar, 100 μm. (D) Quantification of Iba1 positive cells. (E) Quantification of the relative mRNA levels of TNF‐ɑ, IL‐1β and IL‐6 in hippocampus. (F) Quantification of the relative mRNA levels of iNOS and CD206 in hippocampus. Representative western blot bands and relative protein levels of SIRT1 and FOXO1 in (G and H) hippocampus and in (I and J) mPFC. n = 6–9 per group. # p < 0.05, ## p < 0.01, ### p < 0.001 versus the Control + Vehicle group or CUS + Vehicle group.
FIGURE 2
FIGURE 2
UB treatment ameliorates depression‐like behaviors and neuroinflammation and abnormal expression of SIRT1 and FOXO1 in the hippocampus of LPS‐exposed mice. (A) Scheme of the experimental procedure. (B) SPT, FST, and locomotor tests. (C) Relative mRNA levels of TNF‐ɑ, IL‐1ɑ, IL‐1β, IL‐6, and IDO in the hippocampus. mRNA levels of M1 type markers iNOS and CD86 (D), and M2 type markers ARG1 and CD206 (E) in the hippocampus. (F and G) Western blot was performed to evaluate the effect of UB on the protein levels of Iba1, IDO, SIRT1, and FOXO1 in the hippocampus. n = 6–7 per group. # p < 0.05, ## p < 0.01, ### p < 0.001 versus the Vehicle + Vehicle group or LPS + Vehicle group.
FIGURE 3
FIGURE 3
The effect of conditional medium (CM) from BV2 cells treated with LPS or/and UB on the proliferation and cell death of HT22 cells. Cell viability assay of the conditional medium collected from the BV2 (A) or HT22 (B) cells with LPS treatment. After treating BV2 or HT22 cells with 0.5 ng/mL LPS for 24 h, the medium supernatant was collected as conditional medium and HT22 or BV2 cells were cultured with conditional medium for 24 h, and then the cell viability was detected using CCK8 assay. Cell viability assay of the conditional medium collected from the BV2 (C) or HT22 (D) cells with LPS or/and UB treatment. (E and F) Live and dead cell double staining assay. BV2 cells were pretreated with UB (0, 10, 20, 40 μmol/L) for 2 h, then treated with LPS (0.5 μg/mL) for 24 h, followed by collecting the medium as conditional medium. HT22 cells were incubated with conditional medium for 24 h, and detected the ratio of live and dead cells by staining the live cells (green) with calcein AM and dead cells (red) with PI. Scale bar, 100 μm. (G and H) The protein levels of Bcl‐2 and Bax of HT22 cells after incubating with conditional medium for 24 h. n = 3–4 per group. # p < 0.05, ## p < 0.01, ### p < 0.001 versus the control group without LPS and UB treatment, or group treated with LPS alone.
FIGURE 4
FIGURE 4
UB inhibits the production of proinflammatory cytokines and M1 polarization in LPS‐stimulated BV2 cells. (A) Experimental diagram. After pretreating with UB (0, 10, 20, 40 μmol/L) for 2 h, BV2 cells were treated with LPS (0.5 μg/mL) for 24 h. RT‐PCR was performed to measure the mRNA levels of inflammatory factors TNF‐ɑ, IL‐1ɑ, IL‐1β, IL‐6, and IL‐10, and IDO. (B) Polarization‐related markers iNOS, CD86, ARG1, and CD206 (C) in BV2 cells. (D‐E) Western blot was performed to detect the protein levels of iNOS, CD86, Arg1, and CD206 in BV2 cells. n = 3 per group. # p < 0.05, ## p < 0.01, ### p < 0.001 versus the control group without LPS and UB treatment, or the group treated with LPS alone.
FIGURE 5
FIGURE 5
The effects of UB on the ROS and the phosphorylation levels of P65, ERK, P38, JNK, and AMPK of BV2 cells. (A) Experimental flow diagram. After pretreating with UB (0, 10, 20, 40 μmol/L) for 2 h, BV2 cells were treated with LPS (0.5 μg/mL) for 24 h. ROS and RNA extraction were performed. (B and C) Intracellular ROS levels were measured using the DCFH‐DA method. Scale bar, 50 μm. (D and E) Western blot was performed to detect the phosphorylation levels of P65, ERK, P38, JNK, and AMPK, the acetylation level of P65, and the expression levels of IDO of BV2 cells. n = 3 per group. # p < 0.05, ## p < 0.01, ### p < 0.001 versus the control group without LPS and UB treatment or the group treated with LPS alone.
FIGURE 6
FIGURE 6
The effect of UB on the proteins secreted by BV2 cells was detected by Quantitative proteomics analysis. (A) Volcano map. (B) Venn map and KEGG analysis. (C) GSEA analysis.
FIGURE 7
FIGURE 7
The effect of UB on the proteins secreted by BV2 cells. (A) KEGG enrichment analysis of chord diagrams. (B) The mRNA level of target genes. n = 3 per group. ## p < 0.01, ### p < 0.001 versus the Vehicle + LPS group or LPS + UB group.
FIGURE 8
FIGURE 8
The effect of conditional medium from BV2 cells on the depressive behaviors in mice. (A) Scheme of the experimental procedure. (B) SPT. (C) SPT and FST. (D) Locomotor. (E) The mRNA expression levels of BDNF in the hippocampus. n = 7–8 per group. # p < 0.05, ## p < 0.01, ### p < 0.001 versus the LPS + Vehicle group, or LPS + UB group.
FIGURE 9
FIGURE 9
SIRT1 and FOXO1 inhibitors attenuated the function of UB. (A and B) Western blot was performed to detect the protein levels of SIRT1, FOXO1, and Ac‐FOXO1 in BV2 cells treated with LPS or UB. (C and D) Experimental flow diagram and CCK8 assay of HT22 cells after incubating with conditional medium from BV2 cells. (E and F) Live and dead cell double staining assay of HT22 cells. Scale bar, 100 μm. (G) Western blot was performed to detect the protein levels of Bax and Bcl‐2. n = 3 per group. # p < 0.05, ## p < 0.01, ### p < 0.001 versus the control groups.
FIGURE 10
FIGURE 10
Knockdown SIRT1 in the hippocampus antagonized the antidepressant effects of UB. (A) Schematic diagram of virus injection and depression‐related behavior tests. (B) The mRNA levels of SIRT1 in the hippocampus. (C) SPT, FST, and locomotor tests. (D) Immunofluorescence test of Iba1 in the hippocampus. Scale bar, 100 μm. n = 4–8 per group. # p < 0.05, ## p < 0.01, ### p < 0.001 versus the GFP + LPS + Vehicle or shSIRT1 + LPS + UB group.

Similar articles

References

    1. Marx W., Penninx B., Solmi M., et al., “Major Depressive Disorder,” Nature Reviews. Disease Primers 9, no. 1 (2023): 44. - PubMed
    1. Bromet E., Andrade L. H., Hwang I., et al., “Cross‐National Epidemiology of DSM‐IV Major Depressive Episode,” BMC Medicine 9, no. 1 (2011): 90. - PMC - PubMed
    1. Monroe S. M. and Harkness K. L., “Major Depression and Its Recurrences: Life Course Matters,” Annual Review of Clinical Psychology 18, no. 1 (2022): 329–357. - PubMed
    1. Chen M. H., Tu P. C., and Su T. P., Next Generation Antidepressants With Novel Mechanisms for Treatment Resistant Depression, 149–168. (Progress in Brain Research, 2023). - PubMed
    1. Espín J. C., Larrosa M., García‐Conesa M. T., and Tomás‐Barberán F., “Biological Significance of Urolithins, the Gut Microbial Ellagic Acid‐Derived Metabolites: The Evidence So Far,” Evidence‐Based Complementary and Alternative Medicine (2013): 1–15. - PMC - PubMed

MeSH terms