. 2025 Apr;31(4):e70372.
doi: 10.1111/cns.70372.

Distribution of Intranasally Administered rIL-10 Along the Olfactory Nerve and Perivascular Space After Intracerebral Hemorrhage

Affiliations

Distribution of Intranasally Administered rIL-10 Along the Olfactory Nerve and Perivascular Space After Intracerebral Hemorrhage

Shaoshuai Wang et al. CNS Neurosci Ther. 2025 Apr.

Abstract

Rationale: The utilization of anti-inflammatory therapy for treating brain diseases holds promise; however, research on intranasal administration of drug compounds remains limited. Quantitative data, particularly pharmacokinetics, are scant, and direct evidence of the distribution of intranasally administered recombinant interleukin 10 (rIL-10) within the brain is lacking.

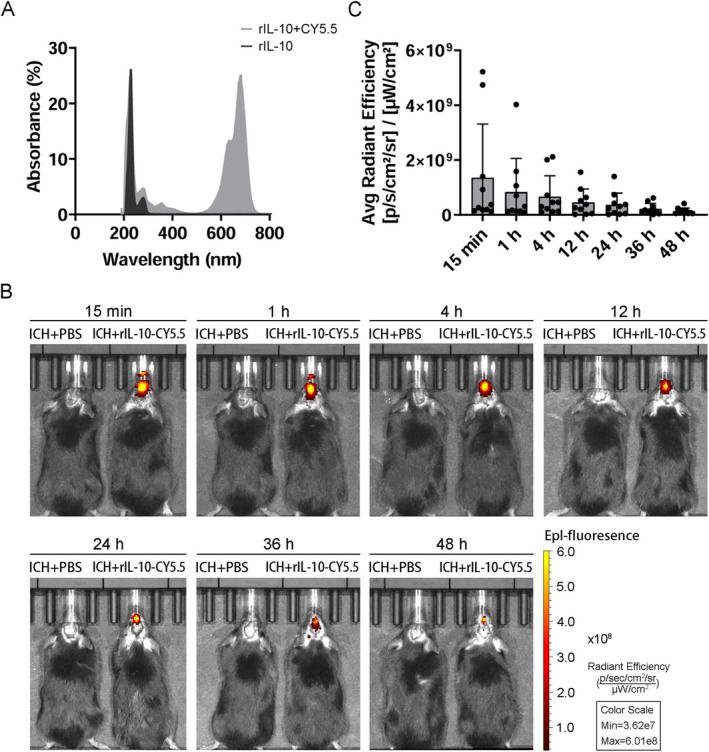
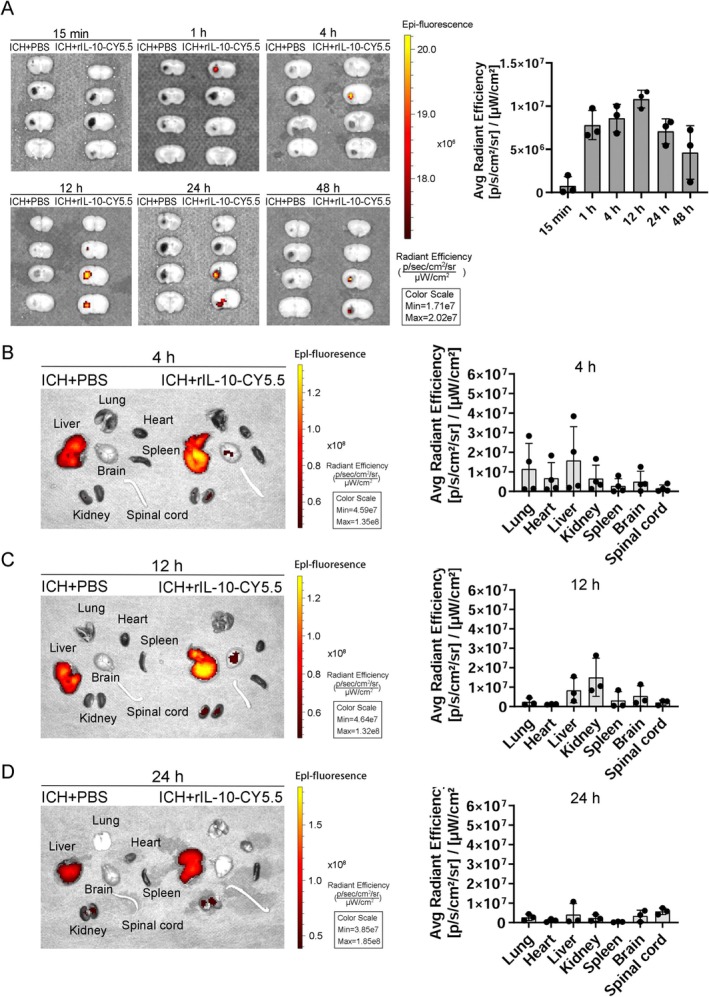
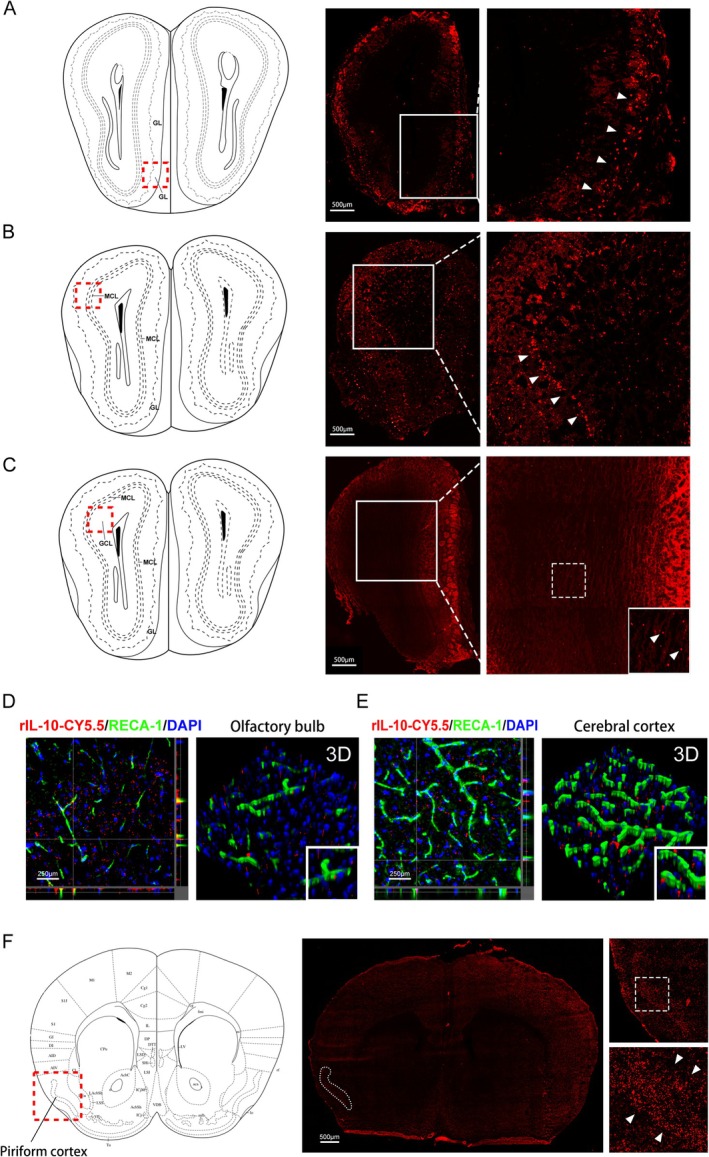
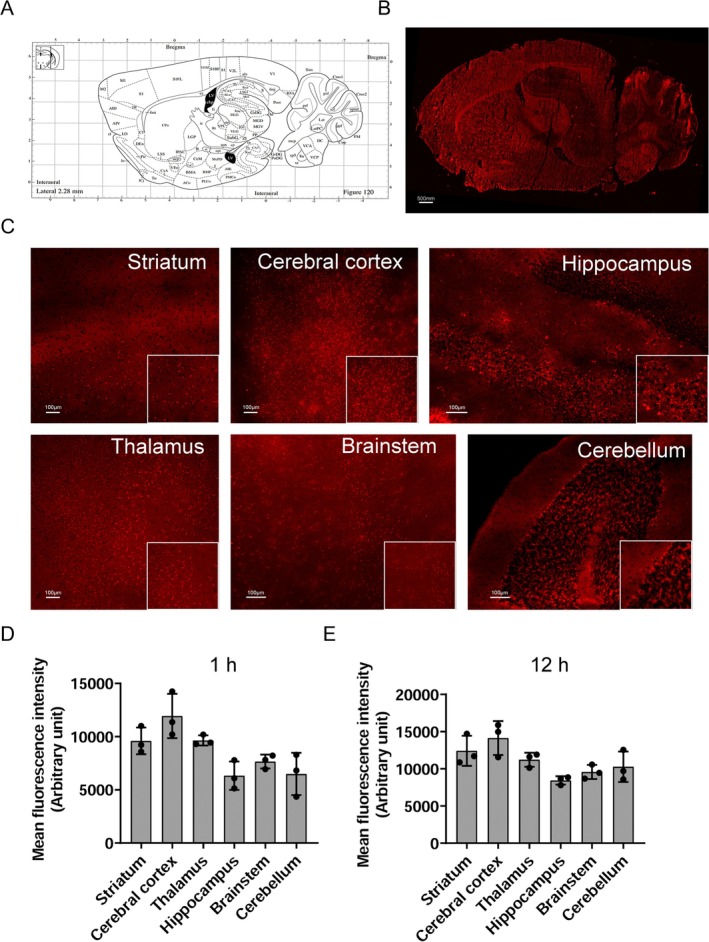
Methods: Employing fluorescent labeling, in vivo imaging, and confocal microscopy, we meticulously monitored the distribution and delivery pathways of intranasally administered rIL-10 in the brain.

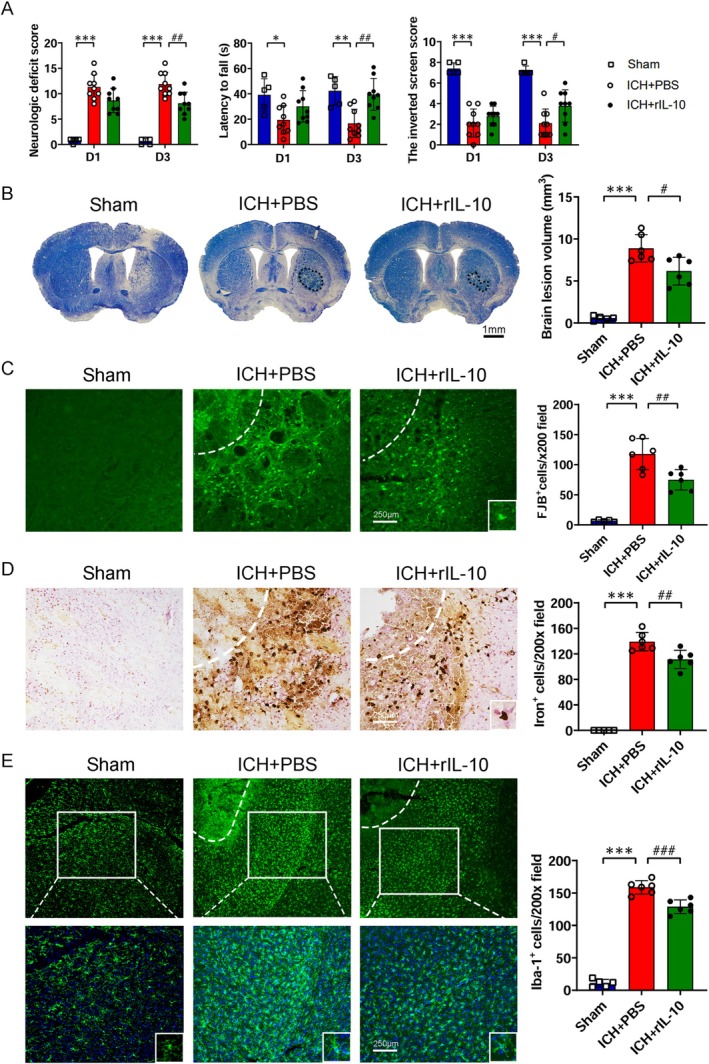
Results and conclusions: Our findings demonstrate that rIL-10 can permeate the blood-brain barrier and reach the perihematomal area in the striatum of mice with intracerebral hemorrhage. Intranasally administered rIL-10 primarily targets the cerebral cortex, striatum, and thalamus, traversing the olfactory nerve pathway and perivascular space to access these brain regions. This mode of delivery effectively mitigated secondary brain injury after intracerebral hemorrhage. This study contributes to intranasal drug delivery research, offering compelling evidence to support the intranasal delivery of anti-inflammatory cytokines or alternative drug candidates for treating brain diseases.

Keywords: BBB; ICH; in vivo imaging; intranasal administration; rIL‐10.


Conflict of interest statement

The authors declare no conflicts of interest.

Figures

FIGURE 1
FIGURE 1
Dynamics of intranasal administration of exogenous CY5.5‐labeled recombinant interleukin‐10 (rIL‐10‐CY5.5) in the intracerebral hemorrhage (ICH) model. (A) Representative UV–vis–NIR spectrum of rIL‐10‐CY5.5. rIL‐10‐labeled CY5.5 demonstrated a typical peak compared to rIL‐10, with excitation wavelengths consistent with those of CY5.5. (B) In vivo images of intranasal administration of rIL‐10‐CY5.5 at different time points in the same mouse. (C) Statistics of average fluorescence intensity in brain regions of mice imaged in vivo at different time points (n = 10).
FIGURE 2
FIGURE 2
Fluorescence distribution in the main organs after the intranasal administration of exogenous CY5.5‐labeled recombinant interleukin‐10 (rIL‐10‐CY5.5) in intracerebral hemorrhage (ICH) model. (A) Distribution and quantitative statistics of fluorescence signals in ex vivo brain: Fresh brain slices were collected at 15 min, 1 h, 4 h, 12 h, 24 h, and 48 h after intranasal administration of exogenous rIL‐10‐CY5.5. These slices were then subjected to fluorescence imaging and data analysis. n = 3. (B) Distribution and quantitative statistics of fluorescence signals in different ex vivo organs at 4 h after intranasal administration of exogenous rIL‐10‐CY5.5. n = 4. (C) Distribution of fluorescence signals in different ex vivo organs at 12 h after intranasal administration of rIL‐10‐CY5.5. n = 3. (D) Distribution and quantitative statistics of fluorescence signals in different ex vivo organs at 24 h after intranasal administration of rIL‐10‐CY5.5. n = 3. We used ICH mice treated with PBS as controls.
FIGURE 3
FIGURE 3
Delivery route for intranasal administration of CY5.5‐labeled recombinant interleukin‐10 (rIL‐10‐CY5.5). Mouse olfactory bulb sections were collected at 1 h after intranasal administration of rIL‐10‐CY5.5. (A) rIL‐10‐CY5.5 fluorescent distribution was observed in the olfactory bulb's glomerular layer (GL) at 8.08 mm interaural and 4.28 mm bregma. (B) rIL‐10‐CY5.5 fluorescent distribution was observed in the olfactory bulb's mitral cell layer (MCL) at 7.72 mm interaural and 3.93 mm bregma. (C) Fluorescence distribution in the olfactory bulb's granule cell layer (GCL) at 7.72 mm interaural and 3.93 mm bregma. (D) Confocal microscopy was used for immunofluorescence imaging on brain slices from the olfactory bulb granule cell layer at 2 h after intranasal administration. rIL‐10‐CY5.5 (red), blood vessels (RECA‐1, green), nucleus (DAPI, blue). The images were captured in 3D. (E) Confocal microscopy was used for immunofluorescence imaging on cerebral cortex brain slices at 2 h after intranasal administration. (F) Distribution of fluorescence signal was observed in the piriform cortex of the mouse brain (Interaural 5.14 mm, Bregma 1.34 mm). The white arrows indicate representative fluorescence signals.
FIGURE 4
FIGURE 4
Fluorescence distribution of CY5.5‐labeled recombinant interleukin‐10 (rIL‐10‐CY5.5) in different brain regions of mice after intranasal administration. (A) Schematic diagram of a sagittal section of the mouse brain, corresponding to the position of the brain slices in B. (B) Fluorescence distribution of rIL‐10‐CY5.5 in sagittal brain sections at 1 h after intranasal administration. (C) Fluorescence distribution of rIL‐10‐CY5.5 in different brain regions at 1 h after intranasal administration. (D) Statistics of fluorescence intensity in different brain regions of mice at 1 h after intranasal administration of rIL‐10‐CY5.5. (E) Statistics of fluorescence intensity in different brain regions of mice at 12 h after intranasal administration of rIL‐10‐CY5.5. n = 3 mice/group.
FIGURE 5
FIGURE 5
Intranasal administration of recombinant interleukin‐10 (rIL‐10) improved neurologic function after intracerebral hemorrhage (ICH). (A) Intranasal administration of rIL‐10 after ICH improved neurologic function on Day 3. The experimental groups included the sham group: N = 5, the ICH + PBS group, and the ICH + rIL‐10 group; n = 9. *p < 0.05, **p < 0.01, ***p < 0.001 versus corresponding sham group; # p < 0.05, ## p < 0.01 versus the ICH + PBS group. Neurologic deficit score, F Interaction = 0.3177, F Row Factor = 0.01054, F Column Factor = 85.7; Wire hanging test, F Interaction = 1.186, F Row Factor = 0.8134, F Column Factor = 14.63; Reverse grid test, F Interaction = 1.09, F Row Factor = 0.5148, F Column Factor = 60.54; Two‐way ANOVA followed by Sidak multiple comparison post hoc test was used for analysis. (B) The lesion volume was calculated by Cresyl Violet/Luxor fast blue (CV/LFB) staining on Day 3 post‐ICH. n = 5–6. ***p < 0.001 versus sham; # p < 0.05 versus ICH + PBS. One‐way ANOVA followed by Tukey multiple comparison post hoc test was used for statistical analysis. (C) Degenerating neurons were calculated by Fluoro‐Jade B (FJB) staining on Day 3 post‐ICH. n = 5–6. ***p < 0.001 versus sham; ## p < 0.01 versus ICH + PBS. One‐way ANOVA followed by Tukey multiple comparison post hoc test was used for statistical analysis. (D) Iron‐positive cells were calculated by Perls' staining on Day 3 post‐ICH. n = 5–6. ***p < 0.001 versus sham; ## p < 0.01 versus ICH + PBS. One‐way ANOVA followed by Tukey multiple comparison post hoc test was used for statistical analysis. (E) The number of activated microglia/macrophages was calculated by counting the active Iba‐1 positive cells on Day 3 post‐ICH. Each group includes a representative high‐magnification image positioned in the lower right corner. n = 5–6. ***p < 0.001 versus sham and ### p < 0.001 versus ICH + PBS. One‐way ANOVA followed by Tukey multiple comparison post hoc test was used for statistical analysis.

Similar articles

References

    1. Zhang W., Xiao D., Mao Q., and Xia H., “Role of Neuroinflammation in Neurodegeneration Development,” Signal Transduction and Targeted Therapy 8 (2023): 267. - PMC - PubMed
    1. Zhu H., Wang Z., Yu J., et al., “Role and Mechanisms of Cytokines in the Secondary Brain Injury After Intracerebral Hemorrhage,” Progress in Neurobiology 178 (2019): 101610, 10.1016/j.pneurobio.2019.03.003. - DOI - PubMed
    1. Jia P., He J., Li Z., et al., “Profiling of Blood‐Brain Barrier Disruption in Mouse Intracerebral Hemorrhage Models: Collagenase Injection vs. Autologous Arterial Whole Blood Infusion,” Frontiers in Cellular Neuroscience 15 (2021): 699736, 10.3389/fncel.2021.699736. - DOI - PMC - PubMed
    1. Keep R. F., Zhou N., Xiang J., Andjelkovic A. V., Hua Y., and Xi G., “Vascular Disruption and Blood‐Brain Barrier Dysfunction in Intracerebral Hemorrhage,” Fluids and Barriers of the CNS 11 (2014): 18. - PMC - PubMed
    1. Long Y., Yang Q., Xiang Y., et al., “Nose to Brain Drug Delivery—A Promising Strategy for Active Components From Herbal Medicine for Treating Cerebral Ischemia Reperfusion,” Pharmacological Research 159 (2020): 104795. - PubMed

MeSH terms

LinkOut - more resources