. 2025 Jun 3;13(6):e0266524.
doi: 10.1128/spectrum.02665-24. Epub 2025 Apr 16.

Mass cytometry analysis reveals a cross-tissue immune landscape in Actinobacillus pleuropneumoniae-induced pneumonia

Affiliations

Mass cytometry analysis reveals a cross-tissue immune landscape in Actinobacillus pleuropneumoniae-induced pneumonia

Yanyan Tian et al. Microbiol Spectr. .

Abstract

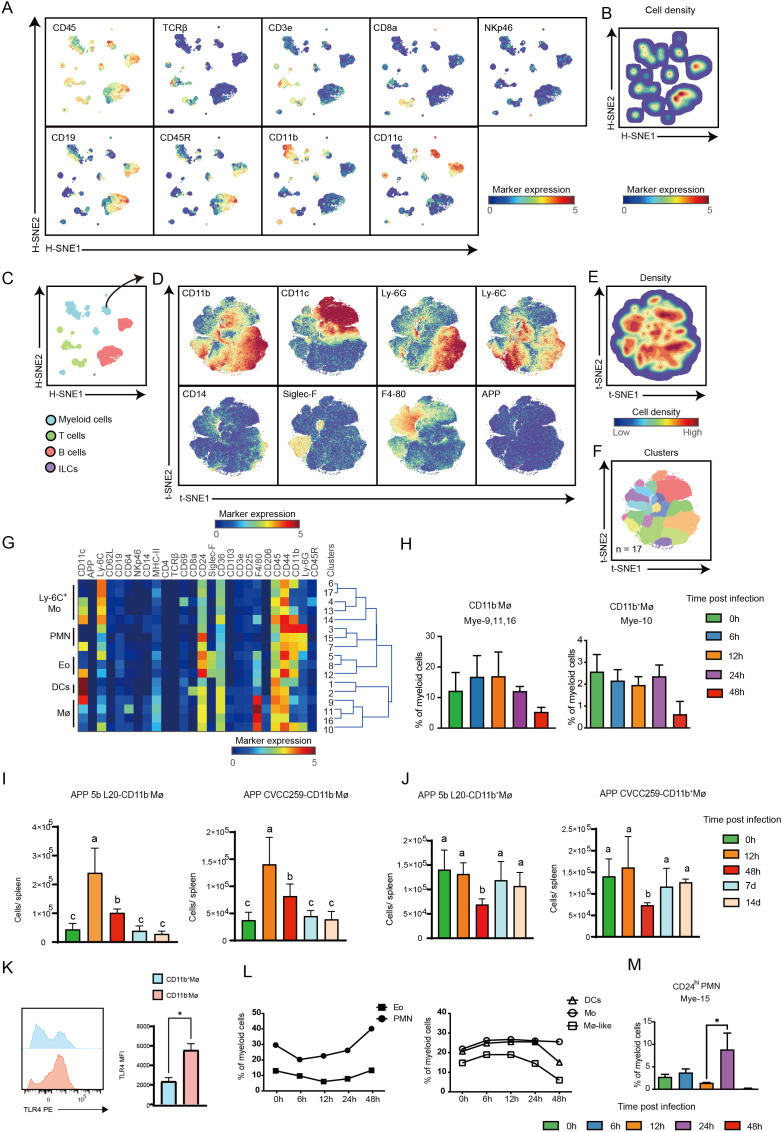
Porcine contagious pleuropneumonia caused by Actinobacillus pleuropneumoniae (APP) is a fatal respiratory disease that threatens the worldwide farming industry's health. The immune responses of extrapulmonary tissues play an important role in developing porcine contagious pleuropneumonia; however, the immune responses of extrapulmonary tissues induced by APP are rarely uncovered. Here, we used high-dimensional mass cytometry to investigate the immune cell response in the spleen and peripheral blood during APP infection in mice. We found that the immune response triggered by APP was highly tissue-specific. Numerous infection time- or tissue-specific immune cell clusters, including previously unrecognized ones, were also identified in the spleen and peripheral blood. Integrative analysis of splenic lymphoid and myeloid cell clusters maps the dynamic immune response cellular network during APP infection. Surprisingly, during the early stages of APP infection, the majority of the top 6 cell clusters contributing to the infection time-specificity in the spleen were adaptive immune cell clusters rather than innate immune cell clusters, among which CD24hiMHCII+CD8+TEM cells exhibited a stronger expression of IFN-γ, IL-17A, and IL-10 compared to the CD24lo compartment. In peripheral blood, there was unprecedented heterogeneity in the immune cell composition. Also, peripheral immune cell clusters closely related to the severity of APP infection were identified. In summary, our data provide a systemic and comprehensive overview of the immune responses to APP infection in the spleen and peripheral blood. This provides a foundation for understanding the immune pathogenesis of APP and identifying potential diagnostic biomarkers and therapeutic targets.

Importance: This study explored the cross-tissue immune dynamic landscape in the APP-induced pneumonia model by utilizing high-dimensional mass cytometry. We discovered that APP-induced immune responses are tissue-specific. Key infection-specific clusters in the spleen and peripheral blood were identified, some of which were previously unrecognized. Meanwhile, the specific functions of APP infection-related immune subsets were explored. The research systematically outlined an overview of immune responses in these tissues, deepening the understanding of APP pathogenesis and laying the foundation for the search for diagnostic and therapeutic targets.

Keywords: Actinobacillus pleuropneumoniae; immune cell clusters; immune response; mass cytometry.


Conflict of interest statement

The authors declare no conflict of interest.

Figures

Fig 1
Fig 1
The immune responses against APP infection are tissue-specific. (A, B) Changes in lung weight change rate, lung weight increase rate, lung index, spleen weight increase rate, spleen index, and pathological changes at 6, 12, 24, and 48 h after APP infection compared to no infection (0 h). (C) HE staining was used to observe pathological damage in the lung and spleen at 6, 12, 24, and 48 h after APP infection compared to no infection (0 h) (20×). (D) HSNE embeddings of 1,290,940 immune cells derived from murine lung (N = 14), spleen (N = 18), and PBMCs (N = 5) at the overview level. Each dot represents a landmark, whose size is proportional to the number of cells it represents. Colors indicate the ArcSinh5-transformed expression value of each indicated marker. (E) HSNE plots show the tissue origin in different colors. (F) HSNE plots show the major immune lineage cluster partitions in different colors. (G) Cell frequencies of each major immune lineage in CD45+ cells across three different tissues during APP infection. (H) The stacked bar graph shows the cell frequencies of the major immune lineages (as % of CD45+ immune cells) in each sample and hierarchical clustering.
Fig 2
Fig 2
Cluster identification in the myeloid cell compartment in the spleen. (A) The HSNE embeddings of 913,382 immune cells derived from the spleen (N = 18). Each dot represents a landmark, whose size is proportional to the number of cells it represents. Colors indicate the ArcSinh5-transformed expression value of each indicated marker. (B) The HSNE plot shows the cell density. (C) A HSNE embedding of 913,382 immune cells derived from the spleen (N = 18). Colors represent different major immune lineages. (D) t-SNE embeddings of 253,778 myeloid cells showing the ArcSinh5-transformed expression value of each indicated marker. (E) A density map showing the local probability density of the embedded cells. (F) A t-SNE plot showing cluster partitions. (G) Heatmap displaying the median marker expression value and hierarchical clustering of the markers for 17 clusters identified in panel F. (H) Cell frequency of Mye-9,11,16,10 in myeloid cells in the spleen. (I, J) Quantification of CD11b+ Mø, CD11bMø after infection with APP 5b L20 and APP CVCC259. Error bars indicated mean ± SD. (K) The expression levels of TLR4 on CD11bMø and CD11b+Mø in the spleen at 12 h after infection with APP 5b L20 using flow cytometry. (L) Cell frequencies of indicated immune clusters in myeloid cells in the spleen. (M) Cell frequency of Mye-15 in myeloid cells in the spleen.
Fig 3
Fig 3
Cluster identification in the lymphoid cell compartment in the spleen. (A, B) Heatmaps display the median marker expression value and hierarchical clustering of the markers for clusters identified in each major immune lineage. (C) Cell frequencies of the indicated immune clusters within each major immune lineage in the spleen. (D, E) Quantification of CD24hiLy-6C+CD8+TEM after infection with APP 5b L20 and APP CVCC259. Error bars indicated mean ± SD. (F) Flow cytometry was used to detect the expression levels of IFN-γ, IL-17A, and IL-10 in CD24hiMHCII+CD8+TEM and CD24loMHCII+CD8+TEM after stimulation with PMA and ionomycin. (G) Levels of cytokines (IL-17A, IL-10, and IFN-γ) secreted by CD24hiMHCII+CD8+TEM and CD24loMHCII+CD8+TEM were detected by flow cytometry (error bars represent median ±SD). (H–J) Cell frequencies of the indicated immune clusters within each major immune lineage in the spleen.
Fig 4
Fig 4
Infection-associated clusters are revealed in the spleen. (A) A t-SNE embedding of 18 spleen samples, where the t-SNE was computed based on the cell frequencies of 65 immune clusters (% of CD45+ cells). One dot represents one sample. (B) t-SNE embeddings of 65 immune clusters from 18 samples. One dot represents one cluster. The size of the dot is proportional to the cell frequency value. The more similar the cell frequencies are across tissues, the closer the clusters are. (C) A table depicts the top six clusters contributing to the infection time-specific t-SNE signatures. (D) A heatmap shows a correlation among 65 immune clusters based on the cell frequencies of total CD45+ cells in each sample and hierarchical clustering. The top six clusters and the clusters significantly differentially enriched in different infection times are highlighted in different colors. Green: 0 h, yellow: 6 h, blue: 12 h, purple: 24 h, and red: 48 h.
Fig 5
Fig 5
Mass cytometric analysis reveals the immune composition of peripheral blood after APP infection. (A-B) Heatmap (blue-to-red scale) displaying the median marker expression value and hierarchical clustering of the markers for myeloid and lymphoid cell clusters (left panel). Heatmap (green-to-yellow scale) showing the corresponding cell frequencies of each cluster within the myeloid or lymphoid cell compartment at each time point. The dendrogram shows the hierarchical clustering of samples in different infection times (right panel). (C) Quantification of CD11c-PMN in peripheral blood after infection with APP 5b L20 and APP CVCC259. Error bars indicated mean ± SD. (D, E) Quantification of CD11c+CD4+TEM in peripheral blood and inguinal lymph nodes after infection with APP 5b L20 and APP CVCC259. Error bars indicated mean ± SD.

References

    1. Soto Perezchica MM, Guerrero Barrera AL, Avelar Gonzalez FJ, Quezada Tristan T, Macias Marin O. 2023. Actinobacillus pleuropneumoniae, surface proteins and virulence: a review. Front Vet Sci 10:1276712. doi:10.3389/fvets.2023.1276712 - DOI - PMC - PubMed
    1. Chien MS, Chan YY, Chen ZW, Wu CM, Liao JW, Chen TH, Lee WC, Yeh KS, Hsuan SL. 2009. Actinobacillus pleuropneumoniae serotype 10 derived ApxI induces apoptosis in porcine alveolar macrophages. Vet Microbiol 135:327–333. doi:10.1016/j.vetmic.2008.09.071 - DOI - PubMed
    1. Li N, Zhu J, Chen P, Bao C, Wang J, Abdelaal T, Chen D, Zhu S, Wang W, Mao J, Scicluna BP, Koning F, Li F, Lei L. 2023. High-dimensional analysis reveals an immune atlas and novel neutrophil clusters in the lungs of model animals with Actinobacillus pleuropneumoniae-induced pneumonia. Vet Res 54:76. doi:10.1186/s13567-023-01207-4 - DOI - PMC - PubMed
    1. Nerland EM, LeBlanc JM, Fedwick JP, Morck DW, Merrill JK, Dick P, Paradis MA, Buret AG. 2005. Effects of oral administration of tilmicosin on pulmonary inflammation in piglets experimentally infected with Actinobacillus pleuropneumoniae. Am J Vet Res 66:100–107. doi:10.2460/ajvr.2005.66.100 - DOI - PubMed
    1. Wagner A, Regev A, Yosef N. 2016. Revealing the vectors of cellular identity with single-cell genomics. Nat Biotechnol 34:1145–1160. doi:10.1038/nbt.3711 - DOI - PMC - PubMed

LinkOut - more resources